For any system administrator overseeing Ubuntu or other Linux-based systems, effective system performance monitoring is absolutely vital. It’s the cornerstone of ensuring smooth, efficient, and reliable operations for your infrastructure.
The Linux ecosystem boasts a wide array of performance monitoring utilities. However, navigating this extensive selection and pinpointing the most suitable tools for your needs can be a daunting task. This guide serves as your comprehensive resource, diving into the most robust and dependable Linux performance monitoring tools. We’ll explore how to effectively track critical system resources, network activity, and server health.
Whether your goal is to diagnose and resolve performance bottlenecks, fine-tune resource allocation for maximum efficiency, or conduct routine system health assessments, the tools detailed below will equip you with invaluable insights into your Linux environment’s performance landscape. These tools are essential for anyone aiming to achieve peak Linux server performance and maintain a healthy IT infrastructure.
Overview of Key Linux Monitoring Tools
Process and Memory Monitoring Tools
Network and Disk Monitoring Tools
System-Wide Monitoring Tools
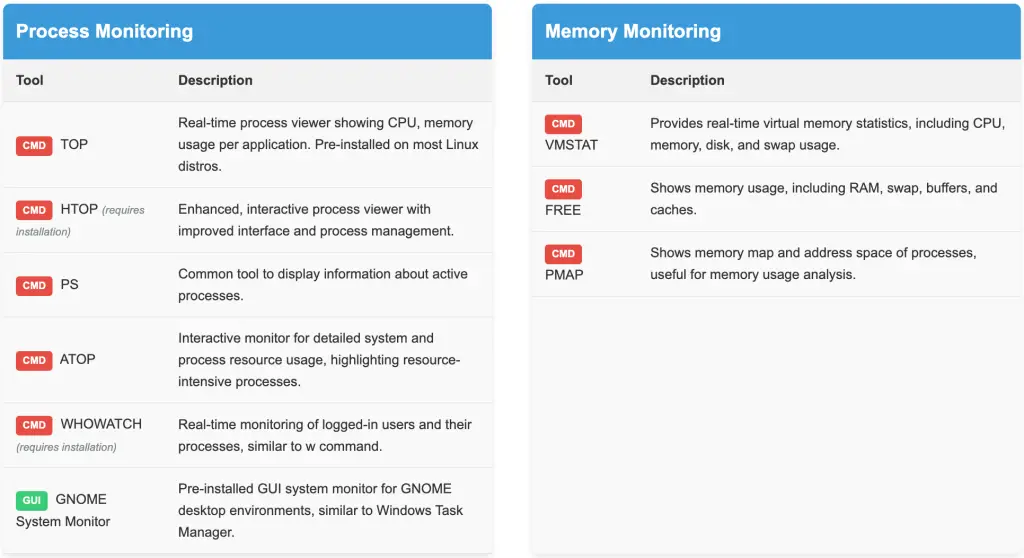
1. TOP – Your Go-To Process Monitoring Command
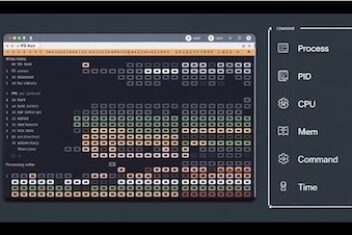
TOP stands out as a foundational and exceptionally popular command-line tool for Linux performance monitoring. It delivers a dynamic, real-time view of system resource utilization, broken down by individual processes. This includes crucial metrics like CPU utilization, memory footprint, process identifiers, and a wealth of other performance indicators. Being a standard utility, TOP is readily available on virtually all Linux distributions right out of the box, making it an immediate asset for system administrators for quick performance checks.
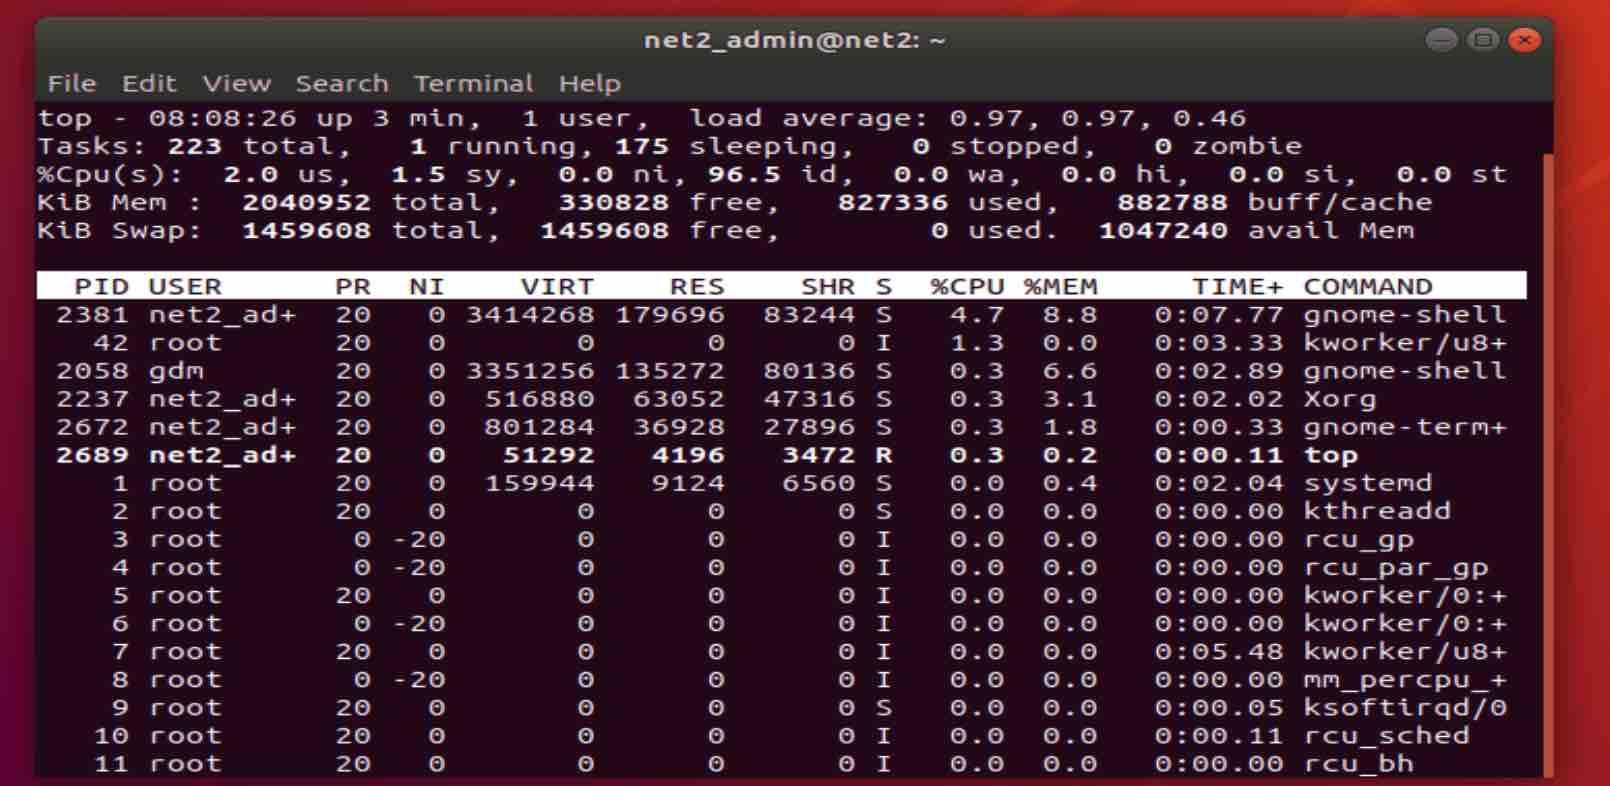
Ubuntu system monitor displaying TOP command output
2. HTOP – An Interactive and User-Friendly Process Viewer for Linux
HTOP is designed as an enhanced alternative to the classic TOP command, offering a more interactive and visually appealing experience for process monitoring in Linux. It builds upon TOP by providing advanced functionalities and a more intuitive interface. One key advantage of HTOP is its streamlined process management capabilities, allowing for faster and simpler termination of processes that are consuming excessive resources. It’s important to note that unlike TOP, HTOP is not pre-installed on most Linux systems and requires a quick installation step before it can be used:
sudo apt-get install htopOnce the installation is complete, launching HTOP is as simple as typing htop in your terminal. This command will immediately bring up the HTOP interactive process viewer, ready for your system monitoring tasks.
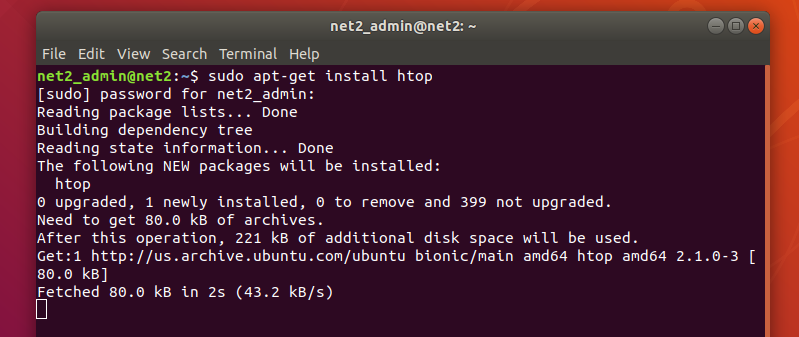
HTOP Installation and User Interface Example
Read: Monitoring system processes in Ubuntu using HTOP
3. VMSTAT – Real-time Virtual Memory and System Statistics
The VMSTAT command is a powerful tool for gaining real-time insights into various aspects of Linux system performance. As a virtual memory statistics reporter, it goes beyond just memory, providing a broad spectrum of system metrics. VMSTAT’s output includes detailed information on disk operations, CPU usage breakdown, memory utilization percentages, thread activity, swap space usage, paging activity, block input/output operations, CPU scheduling context switches, and other essential process-related data. To utilize VMSTAT, simply open your Linux terminal and execute the vmstat command. The resulting output will present a snapshot of your system’s current performance status, giving you immediate feedback on system health and resource usage.
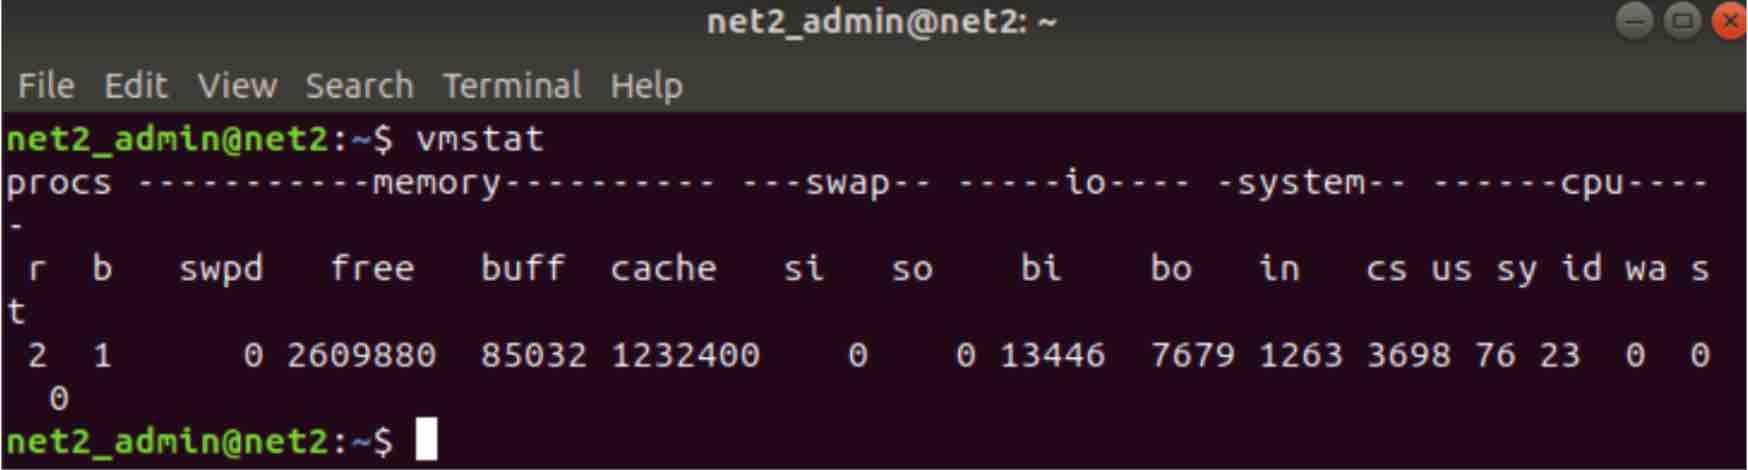
Example VMSTAT command output in terminal
For accessing SLABINFO reports, which provide kernel memory allocator statistics, you’ll need administrative privileges. Use the vmstat -m command to enable this feature:
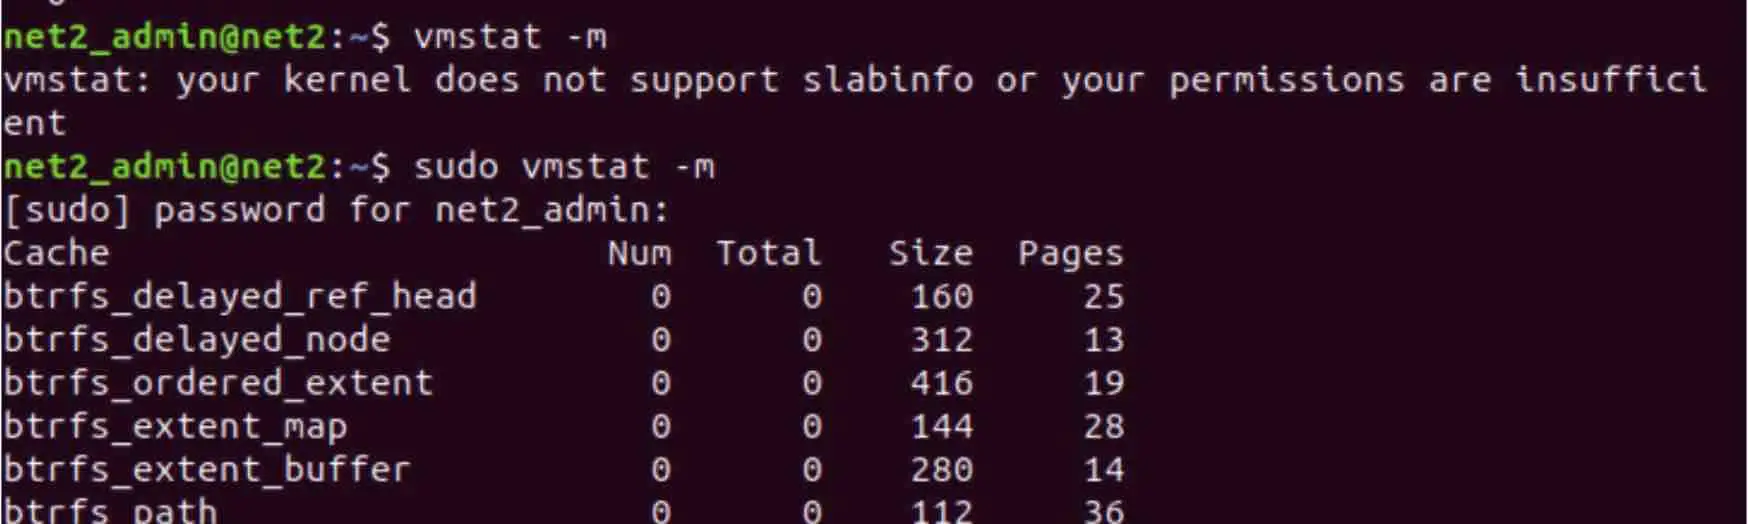
VMSTAT command with SLABINFO reporting enabled
To specifically monitor disk activity statistics with VMSTAT, employ the vmstat -d argument. This will tailor the output to focus on disk-related metrics:
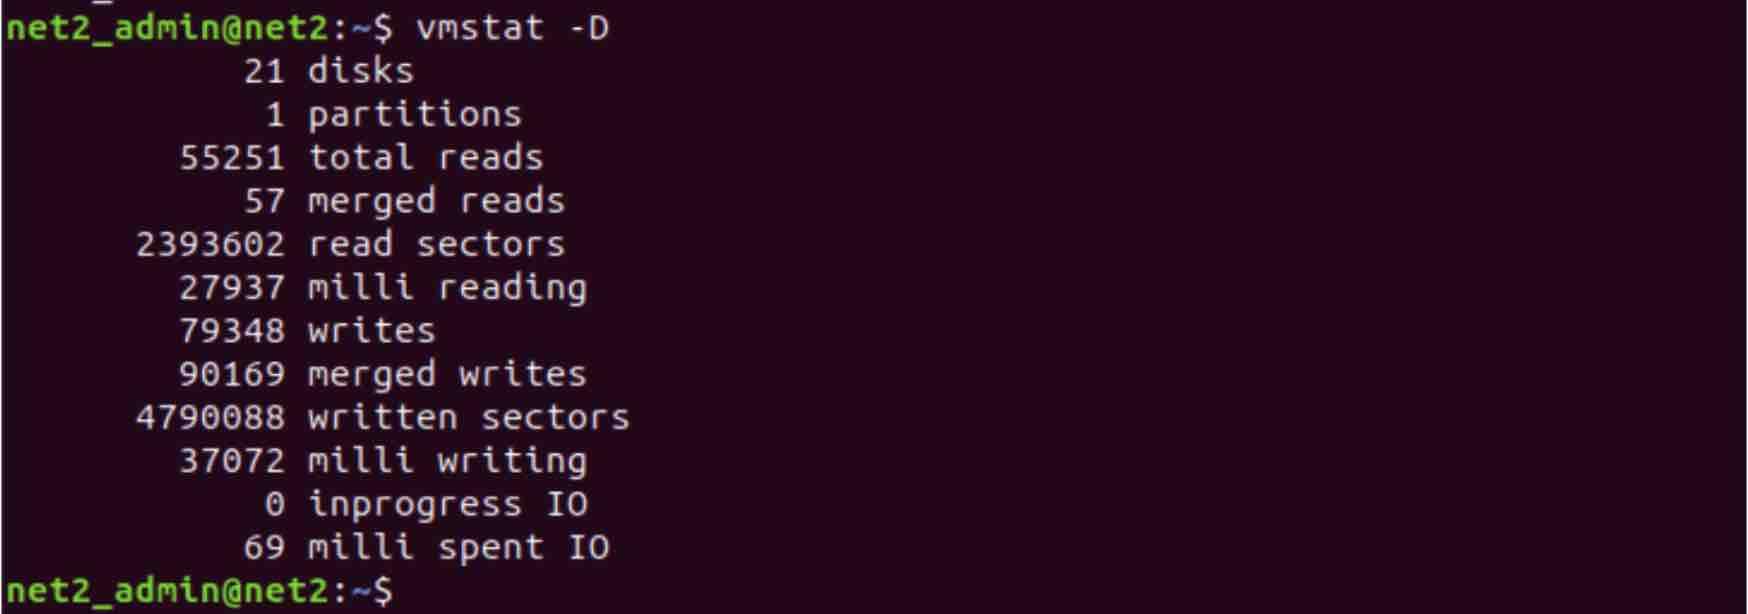
VMSTAT output focused on disk statistics
For detailed insights into active and inactive memory pages along with swap usage, utilize the following command variation:
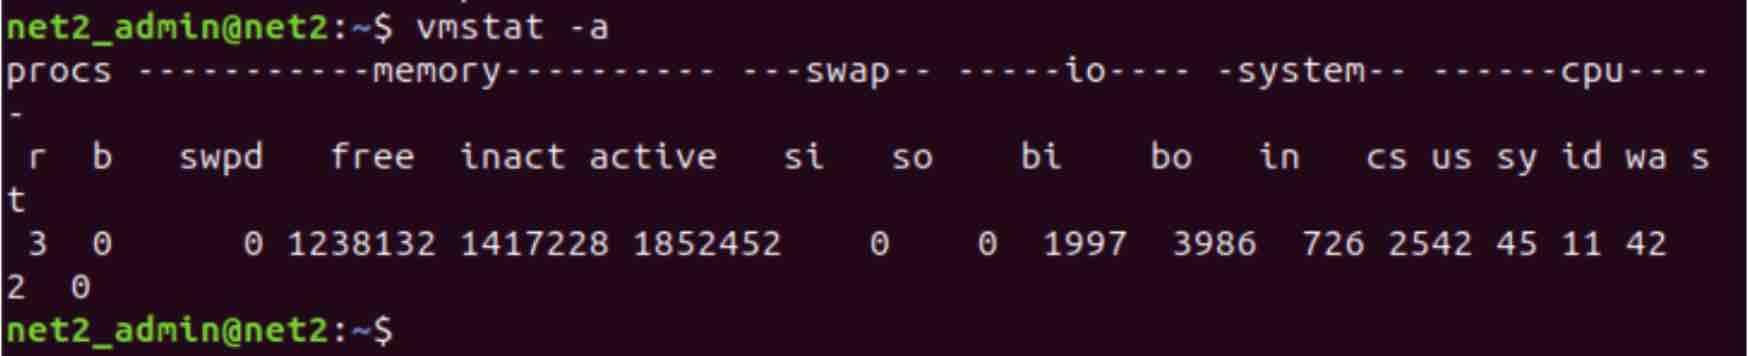
VMSTAT providing memory pages and swap information
Read: What you need to do to secure Ubuntu
4. W Command – Monitor Current User Activity on Linux
The W utility in Linux is designed to provide system administrators with information about users currently logged into the system and their ongoing activities. While it shares some similarities with the WHO command, W distinguishes itself by offering a more in-depth view of user activity. To check the activity of a specific user, simply type w username in the terminal, replacing “username” with the actual username you wish to monitor. This command will display details pertinent to that particular user’s active sessions and processes.
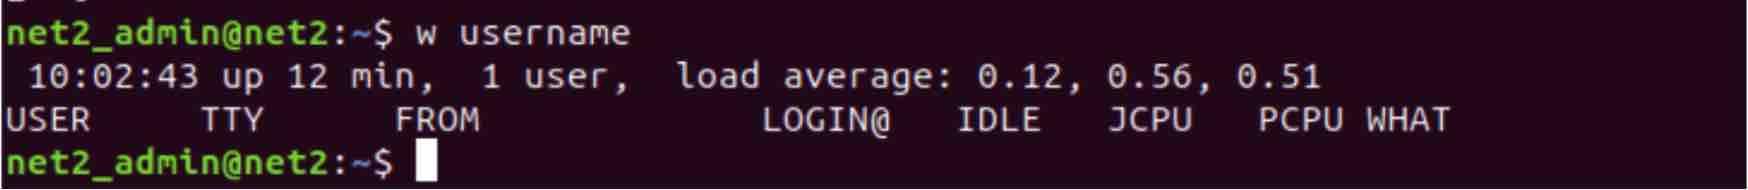
Sample output of the W command in Linux
A typical output from the W command might look like this:
10:18:17 up 2 days, 11:18, 2 users, load average: 0.16, 0.26, 0.29
USER     TTY      FROM             LOGIN@   IDLE   JCPU   PCPU WHAT
root     pts/0    10.2.0.15        10:15    5.00s  0.03s  0.02s vmstat
root     pts/1    10.2.0.15        11:13    2.00s  0.02s  0.00s top
Here’s a breakdown of what each column in the W command output represents:
| Column | Description |
|---|---|
| USER | Displays the username of the user currently logged into the system. |
| TTY | Indicates the terminal type being used by the user, such as ‘pts/0’ for a pseudo-terminal or ‘console’ for the system console. |
| FROM | Shows the remote IP address or hostname from which the user has logged in, if applicable (for remote logins). |
| LOGIN@ | Specifies the time at which the user logged into the system. |
| IDLE | Represents the amount of idle time for the user, indicating how long it has been since the user last interacted with the terminal. |
| JCPU | JCPU (Job CPU time) shows the total CPU time used by all processes associated with the user since their login. |
| PCPU | PCPU (Process CPU time) displays the CPU time utilized by the user’s currently active process, which is listed under the ‘WHAT’ column. |
| WHAT | The ‘WHAT’ column shows the command line of the current process being executed by the user. This helps identify what task the user is currently running. |
Read: Ubuntu Command-Line Mastery: The Essential Guide for Power Users
Overview of Key System Monitoring Tools
5. FREE – Analyze Memory Usage in Your Linux System
The FREE command is an essential utility for quickly assessing memory usage within a Linux environment. It provides a snapshot of how memory resources are currently allocated, displaying information about both available and used memory. The output from FREE includes total system memory, the amount of memory currently free, the memory that is actively in use, and details about swap space utilization. Furthermore, FREE goes into finer detail by providing insights into kernel buffers and caches, which are critical aspects of Linux memory management. Understanding these figures is key to optimizing application performance and ensuring efficient resource allocation.
Executing the simple command free in your terminal will generate an output that looks similar to this:
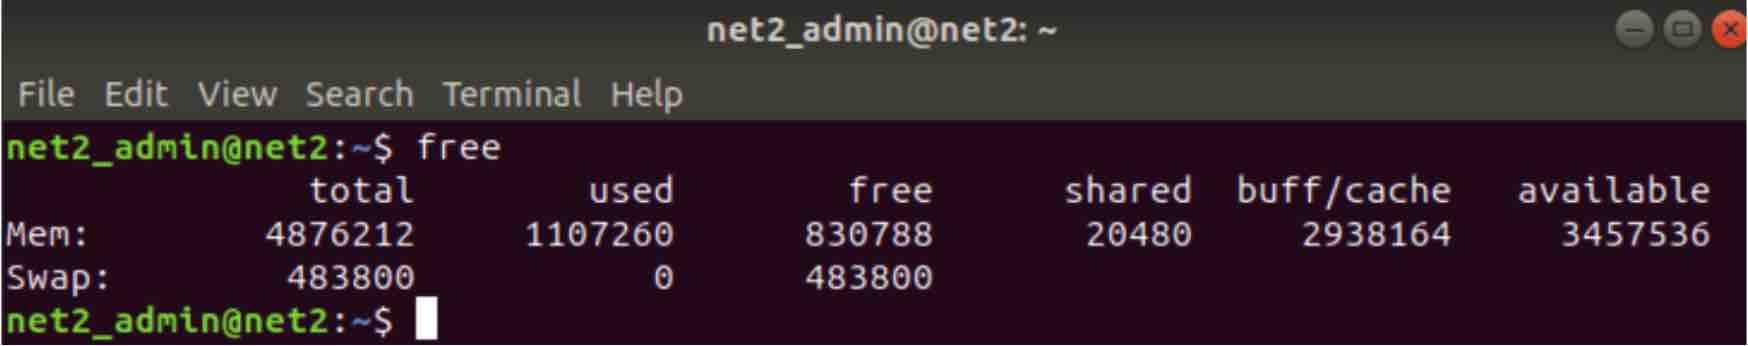
Example output of the FREE command showing memory usage
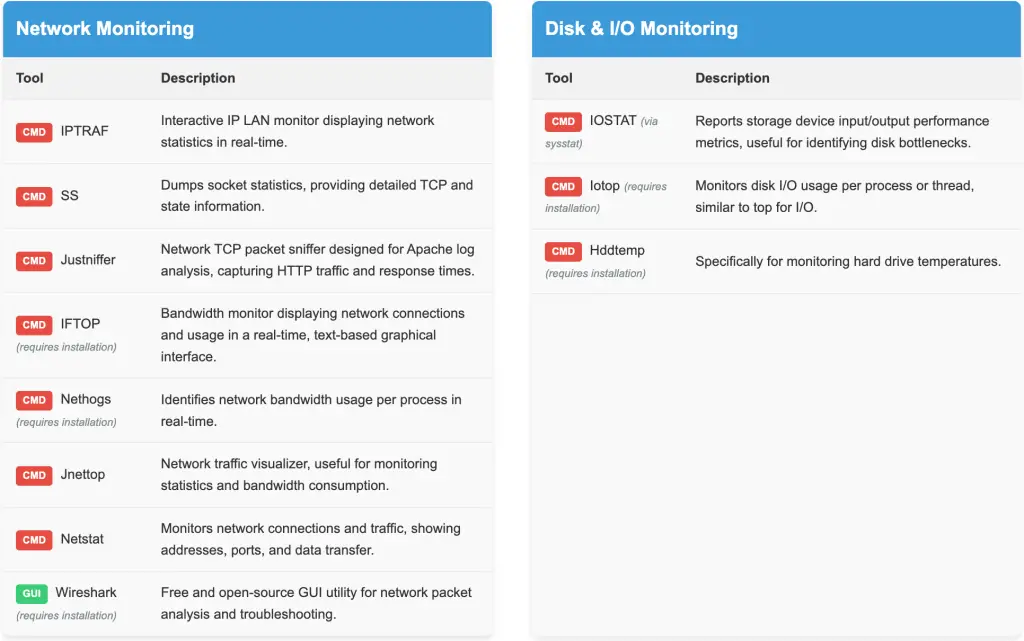
6. IPTRAF – Interactive Network Monitoring for Linux Systems
IPTRAF is a powerful, visually-driven IP LAN monitoring tool for Linux, built upon the ncurses library to provide an interactive terminal interface. What sets IPTRAF apart is its ability to generate a wide spectrum of real-time network statistics, presented in an easy-to-interpret, color-coded display. Key network metrics provided by IPTRAF include UDP packet counts, detailed TCP connection information, OSPF (Open Shortest Path First) and ICMP (Internet Control Message Protocol) data, per-node network statistics, Ethernet interface load levels, IP checksum errors detected, and a variety of other crucial network performance indicators. For system administrators needing a quick, visual grasp of network traffic and health directly in the terminal, IPTRAF is an invaluable tool.
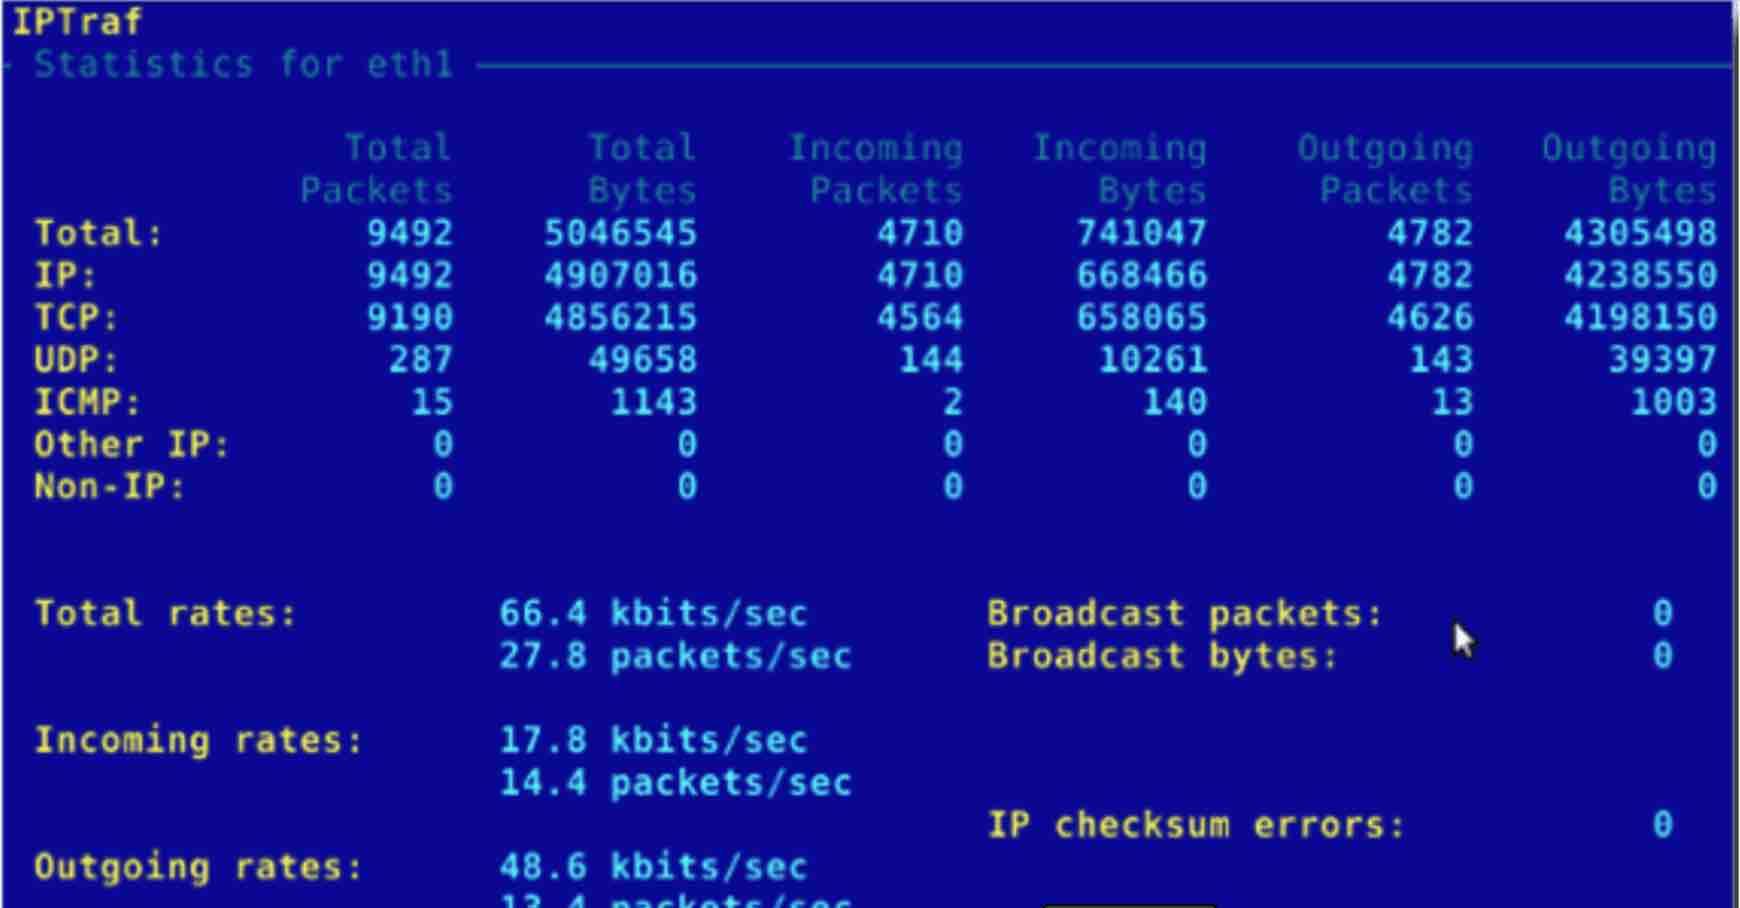
IPTRAF interactive network monitoring interface
7. SS – Detailed Socket Statistics for Linux Networking
The SS command, short for Socket Statistics, serves a similar purpose to the older netstat command but is often favored for its speed and the more detailed output it provides. SS is used to dump socket statistics, giving administrators a comprehensive view of network socket activity on a Linux system. Compared to other networking tools, SS excels in providing extensive TCP socket information, including detailed state breakdowns and various TCP-specific metrics. This rich level of detail makes SS particularly useful for in-depth network troubleshooting, performance analysis, and real-time monitoring of network connections and traffic flow.
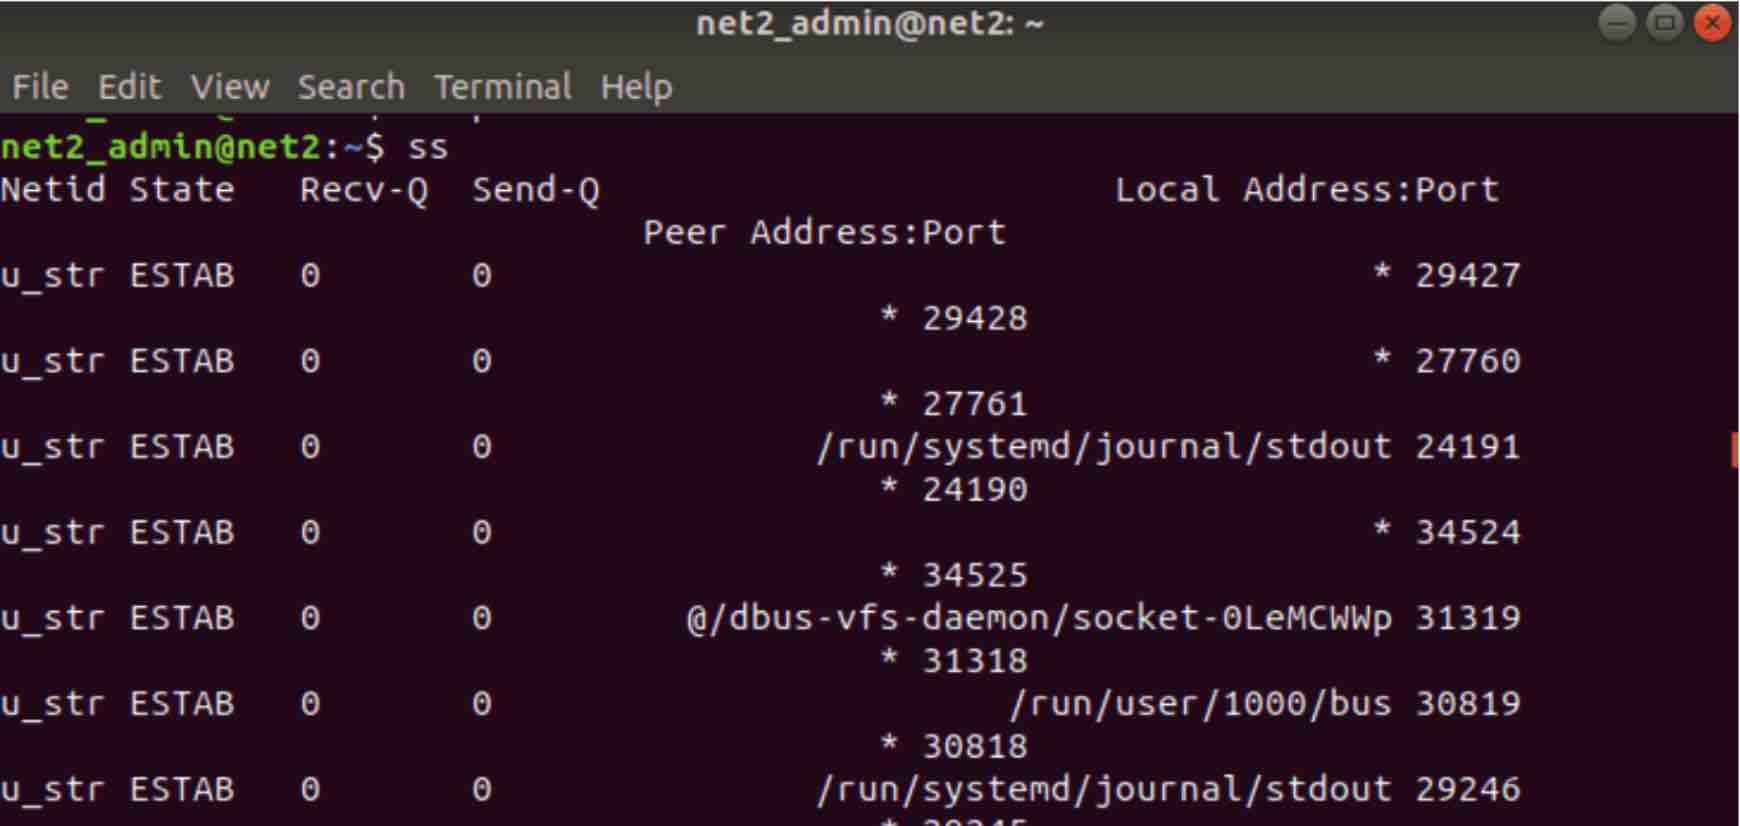
Sample output from the SS command in Linux
The SS command is highly versatile and supports a wide range of options to tailor its output. For a complete understanding of all available options and functionalities, it’s recommended to consult the command’s manual page by running man ss in your terminal.
8. UPTIME – Quick System Uptime and Load Monitoring
The UPTIME command offers a straightforward way to determine the duration for which your Linux system has been continuously running. By simply executing uptime in the terminal, you receive a concise single-line output that summarizes key system health metrics. This output typically includes the current system time, the total system uptime since the last boot, the number of users currently logged into the system, and the system load averages calculated over the past 1-minute, 5-minute, and 15-minute intervals. The load average figures are particularly useful for getting a quick sense of the system’s overall workload and whether it’s experiencing performance strain.
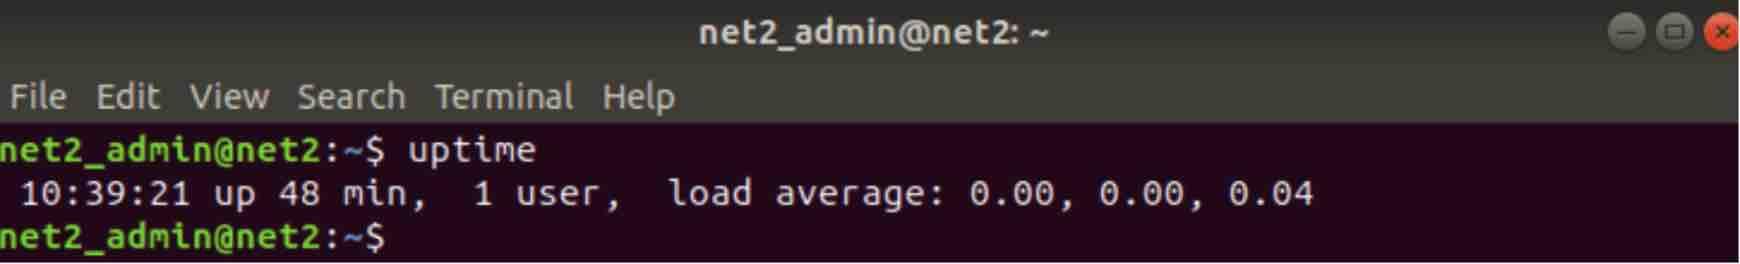
Example output of the UPTIME command
9. Justniffer – TCP Packet Sniffer for Network Analysis
Justniffer is a specialized network tool designed for capturing and analyzing TCP packets. It functions as a network protocol data analyzer, capable of inspecting both low-level packet details and high-level application traffic. A key feature of Justniffer is its focus on web server log data, particularly from Apache web servers. It’s engineered to parse and log data in formats that mirror Apache web server log files, making it ideal for web traffic analysis. Beyond logging, Justniffer can intercept and reconstruct files transmitted over HTTP, enabling retrieval of web content from network traffic. It also offers capabilities to track web server response times and trace TCP network traffic, either from live network connections in real-time or from previously captured packet files. This makes Justniffer a versatile tool for web performance monitoring and network diagnostics.
Read: How to install Apache web server on Ubuntu
Linux Performance Monitoring Tools for System Administrators
10. ATOP – Advanced System and Process Monitoring in Linux
ATOP represents an advanced, interactive system monitoring tool for Linux, going beyond basic resource tracking. It provides a comprehensive view of system load, but crucially, it’s designed to pinpoint the processes that are the primary contributors to high CPU, memory, disk, or network usage. Unlike simpler tools, ATOP not only shows you that there’s a resource bottleneck but also helps you quickly identify which processes are causing the strain. This focus on process-level detail makes ATOP invaluable for performance troubleshooting and resource optimization. After installation, you can launch ATOP simply by typing the atop command in your terminal. Its interactive interface then provides a continuously updated display of system and process metrics, allowing for real-time performance analysis.
To get started with ATOP, first ensure it’s installed on your system. Installation steps can vary based on your Linux distribution (e.g., using apt-get install atop on Debian/Ubuntu or yum install atop on CentOS/RHEL). Once installed, running ATOP is as straightforward as typing the command in your terminal:
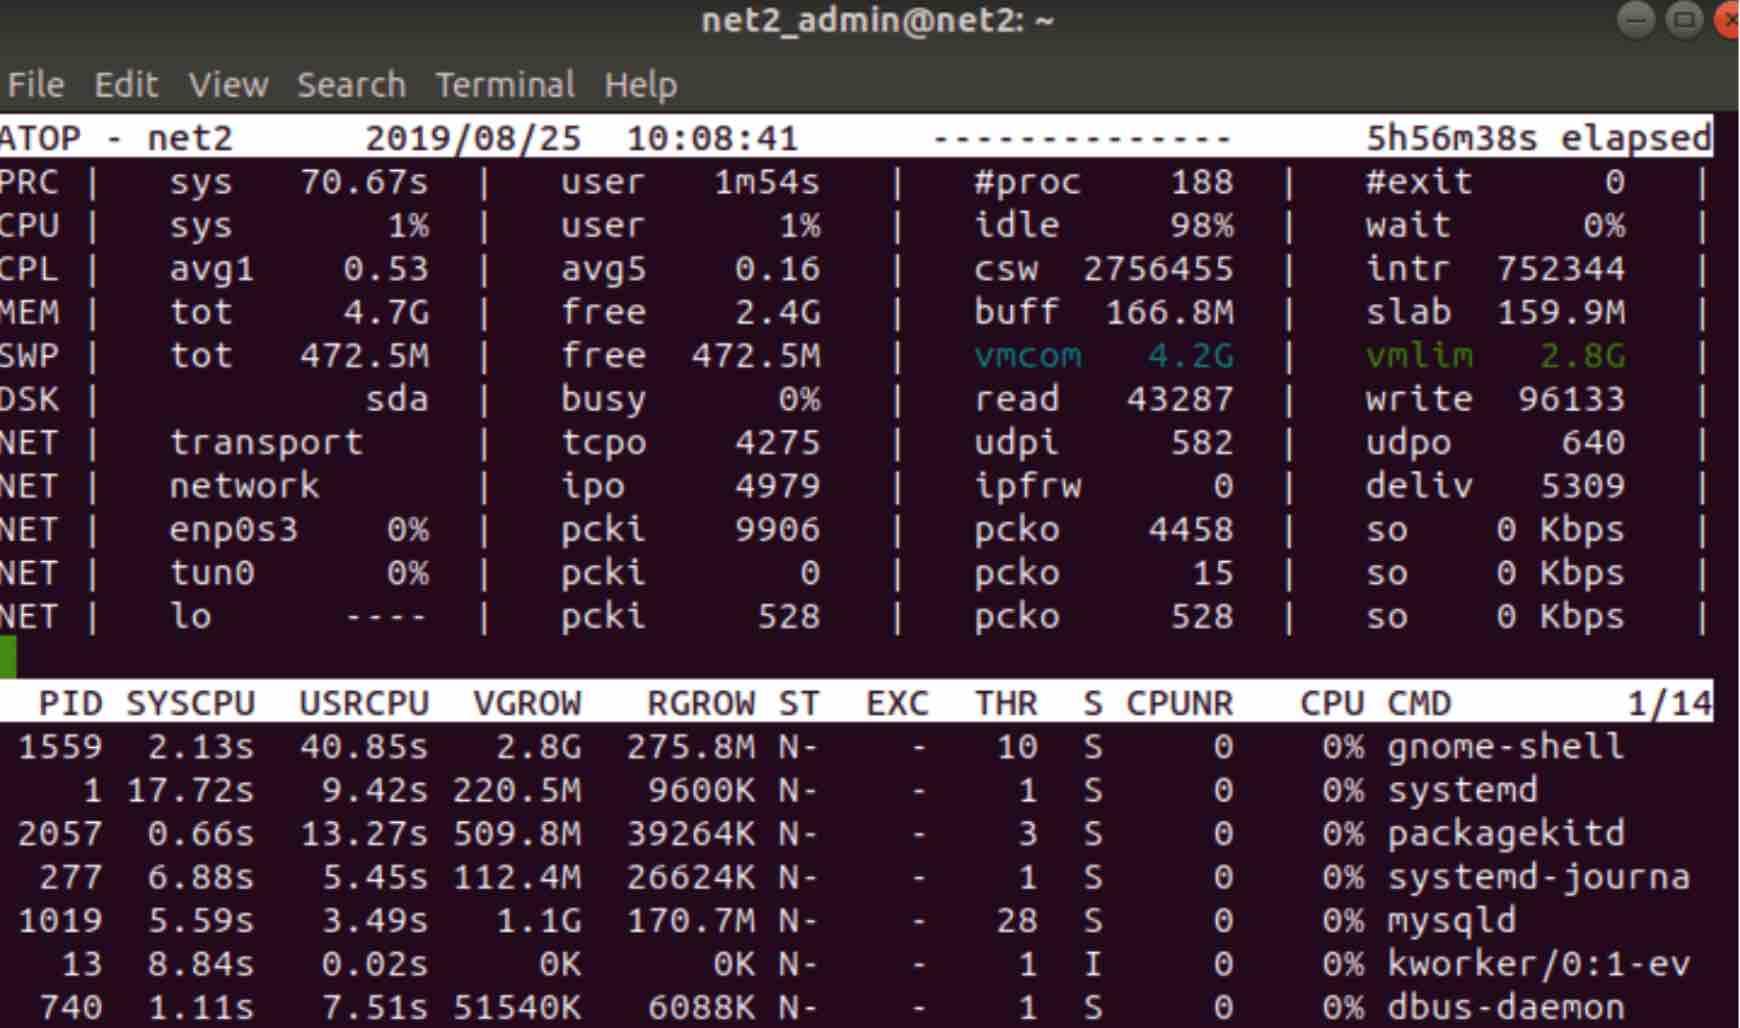
ATOP advanced system and process monitor interface
11. IOSTAT – Disk Input/Output Performance Analyzer
The IOSTAT utility is designed to gather and present comprehensive statistics related to the input and output performance of storage subsystems. This includes both locally attached drives and network-connected storage. System administrators frequently rely on IOSTAT to pinpoint bottlenecks and performance limitations that stem from storage operations.
It’s worth noting that IOSTAT might not be included in the default installation of your Linux distribution. If it’s not readily available, you can easily install it by using your system’s package manager to install the sysstat package:
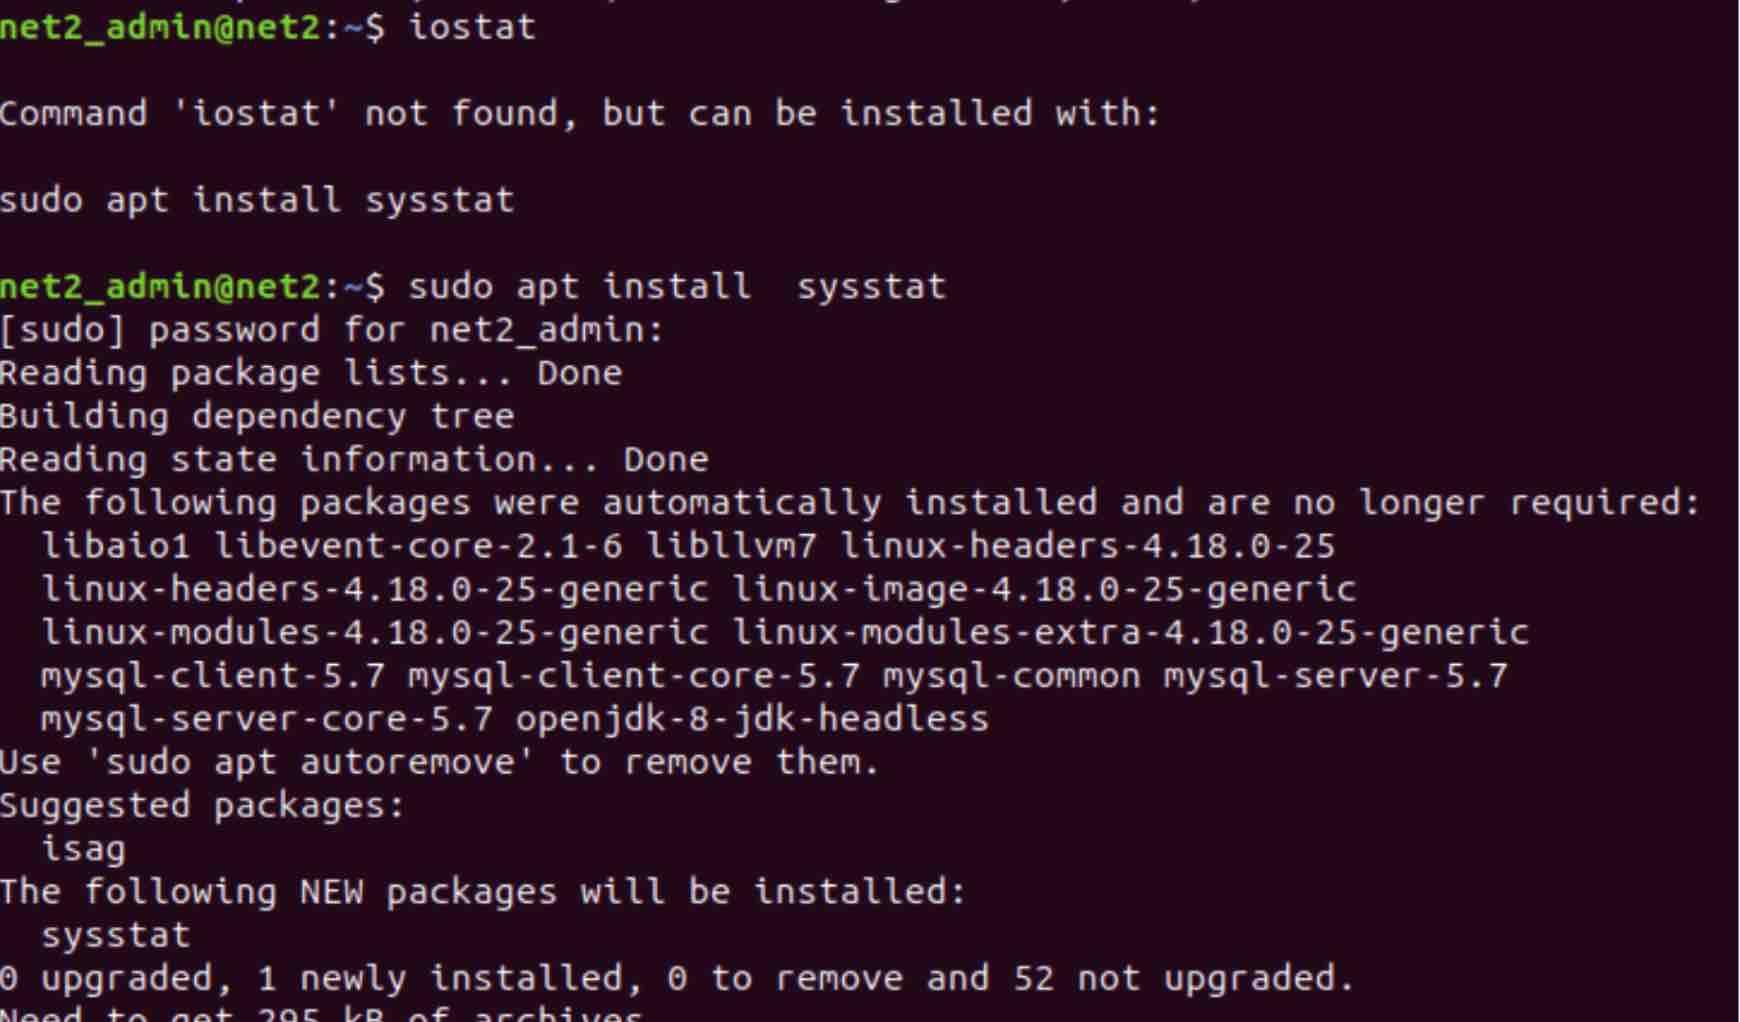
Command to install IOSTAT using system package manager
Once the installation process is complete, simply executing the command iostat in your terminal will generate an output providing a snapshot of your system’s I/O performance:
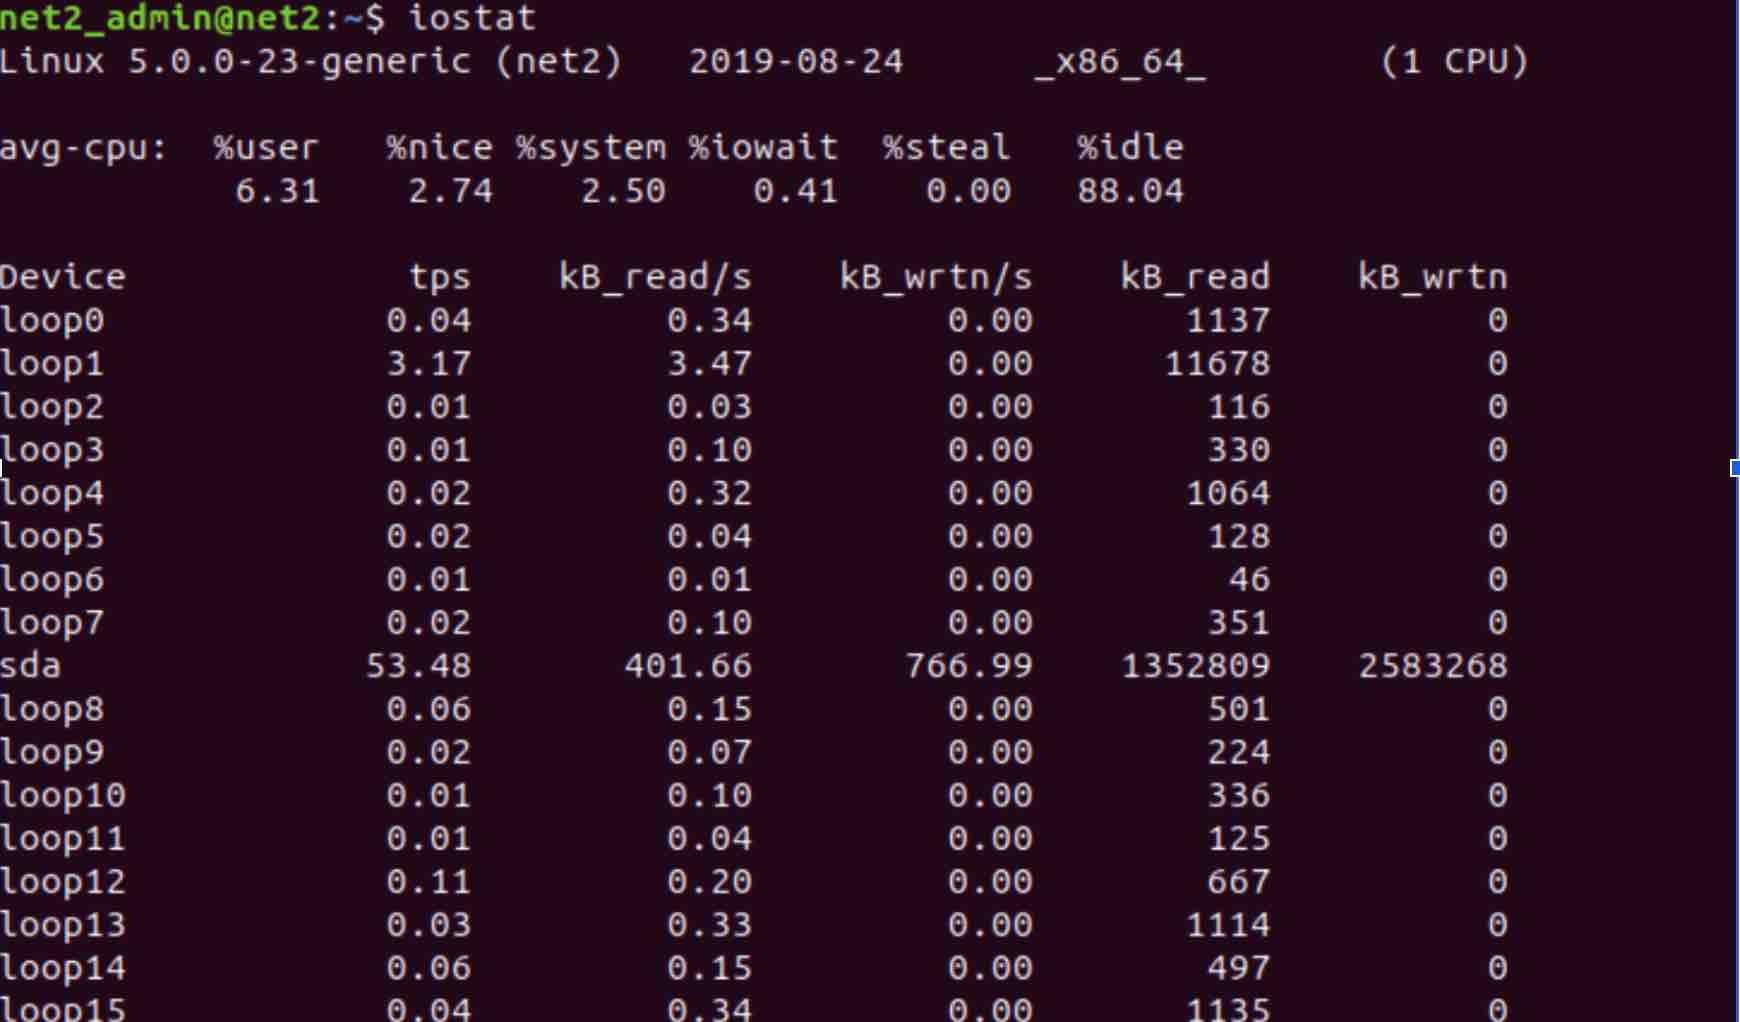
Example output from the IOSTAT command showing I/O statistics
Read: Monitor and Optimize Memory Usage on Ubuntu 22.04 for Peak Performance
12. PS – Unveiling Process Status on Linux
PS, short for Process Status, is a widely employed command-line tool in Linux for displaying detailed information about active processes currently running on the system. It provides a snapshot of the process landscape at the moment of execution.
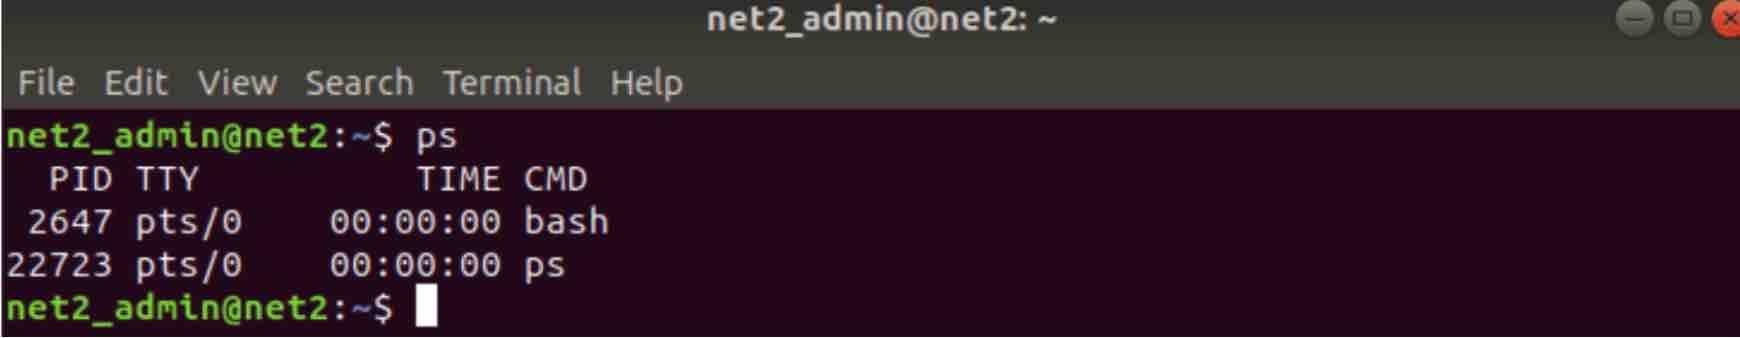
Basic output of the PS command
The standard output from the ps command presents data in columns, with each column representing a specific attribute of the running processes:
- PID:
This column displays the Process ID, a unique numerical identifier assigned to each running process.
- TTY:
The TTY column indicates the terminal (or pseudo-terminal) identifier from which the process was initiated or is controlled.
- TIME:
TIME represents the cumulative CPU time that the program has consumed since it started execution.
- CMD:
CMD, or Command, shows the command-line instruction used to launch the respective process.
To obtain a list of all processes currently running on the system, regardless of the initiating user or terminal, you can use the ps -a command:
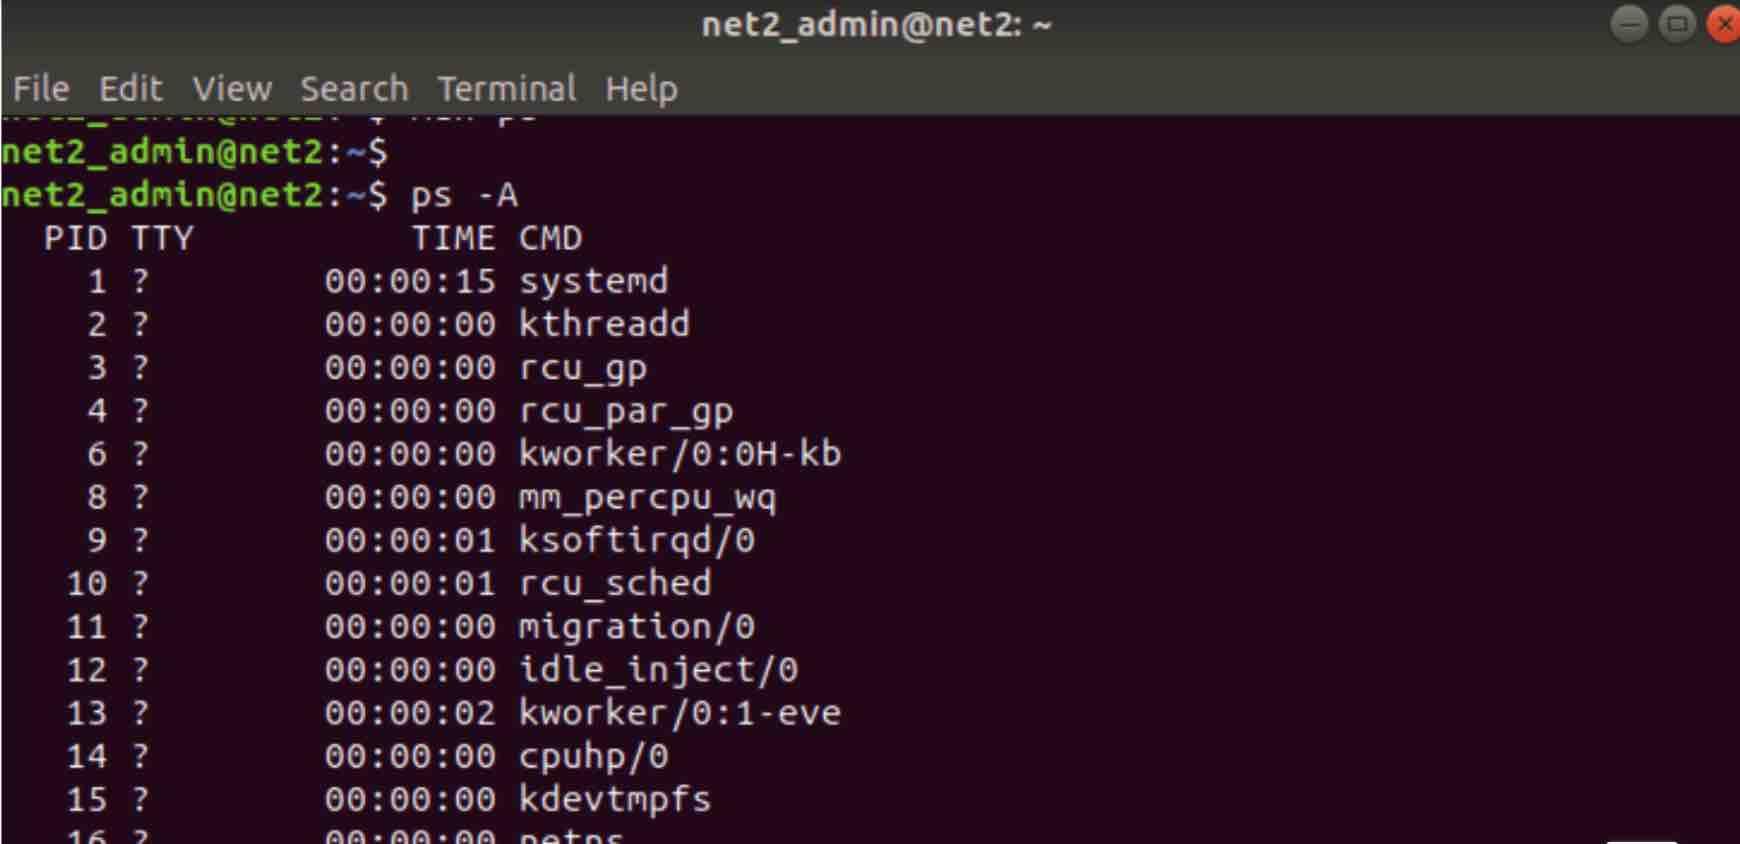
Output of the PS command with the ‘-a’ flag to show all processes
To identify and display the top 5 processes that are consuming the most memory resources, you can use a combination of commands. The following pipeline utilizes ps, sort, and head to achieve this:
# ps -auxf | sort -nr -k 4 | head -10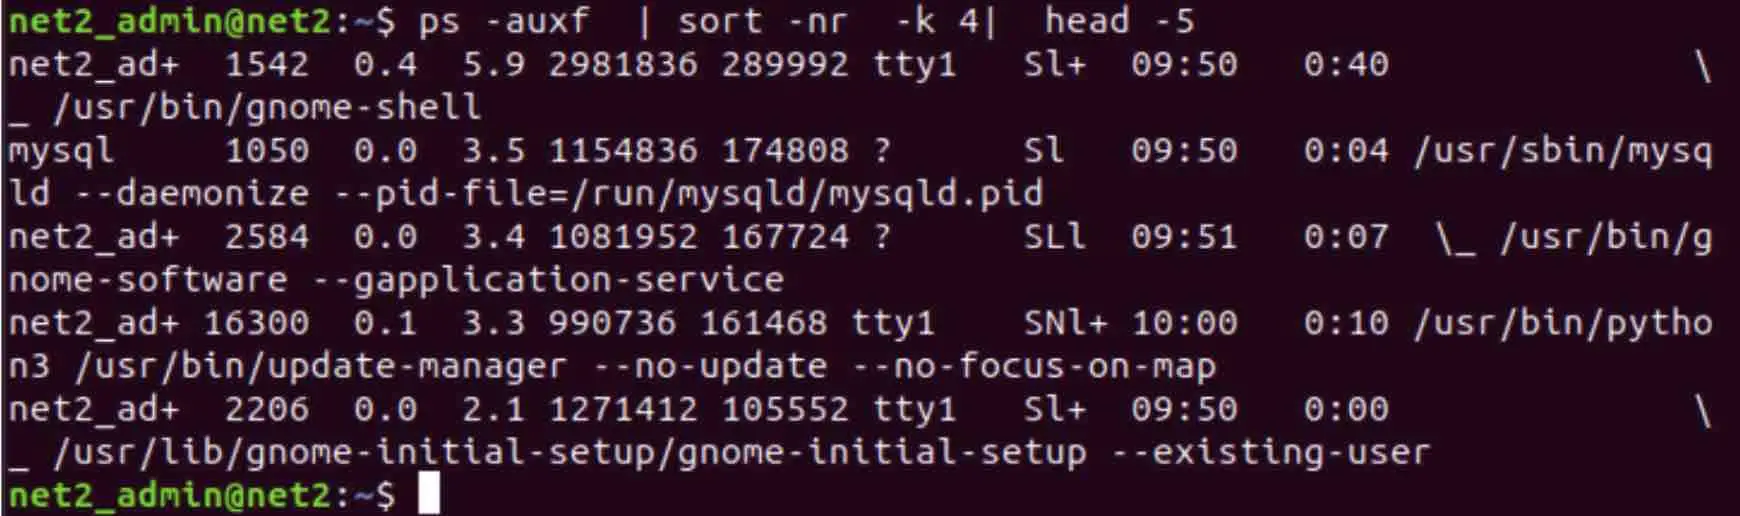
Listing the top memory-consuming processes using PS, SORT, and HEAD commands
Similarly, to identify and display the top 5 processes that are utilizing the most CPU time, you can adjust the sorting criterion to focus on CPU usage. The command below sorts by CPU usage and displays the top entries:
# ps -auxf | sort -nr -k 3 | head -5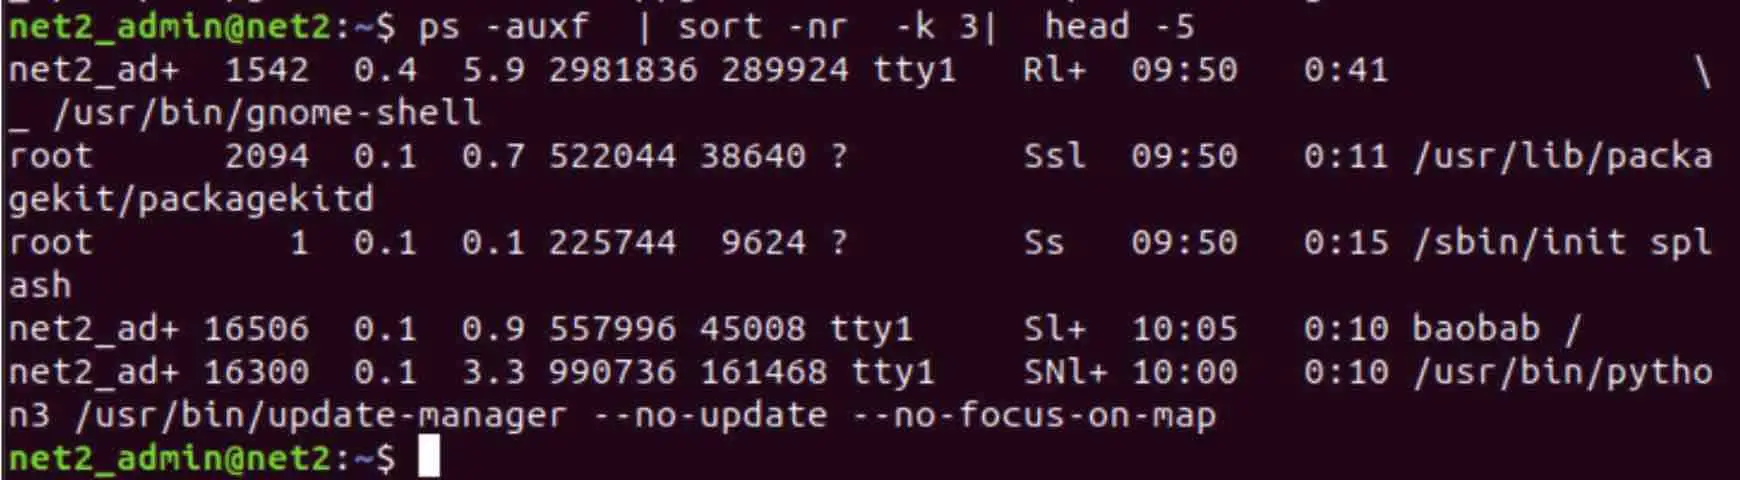
Identifying the top CPU-consuming processes with PS, SORT, and HEAD
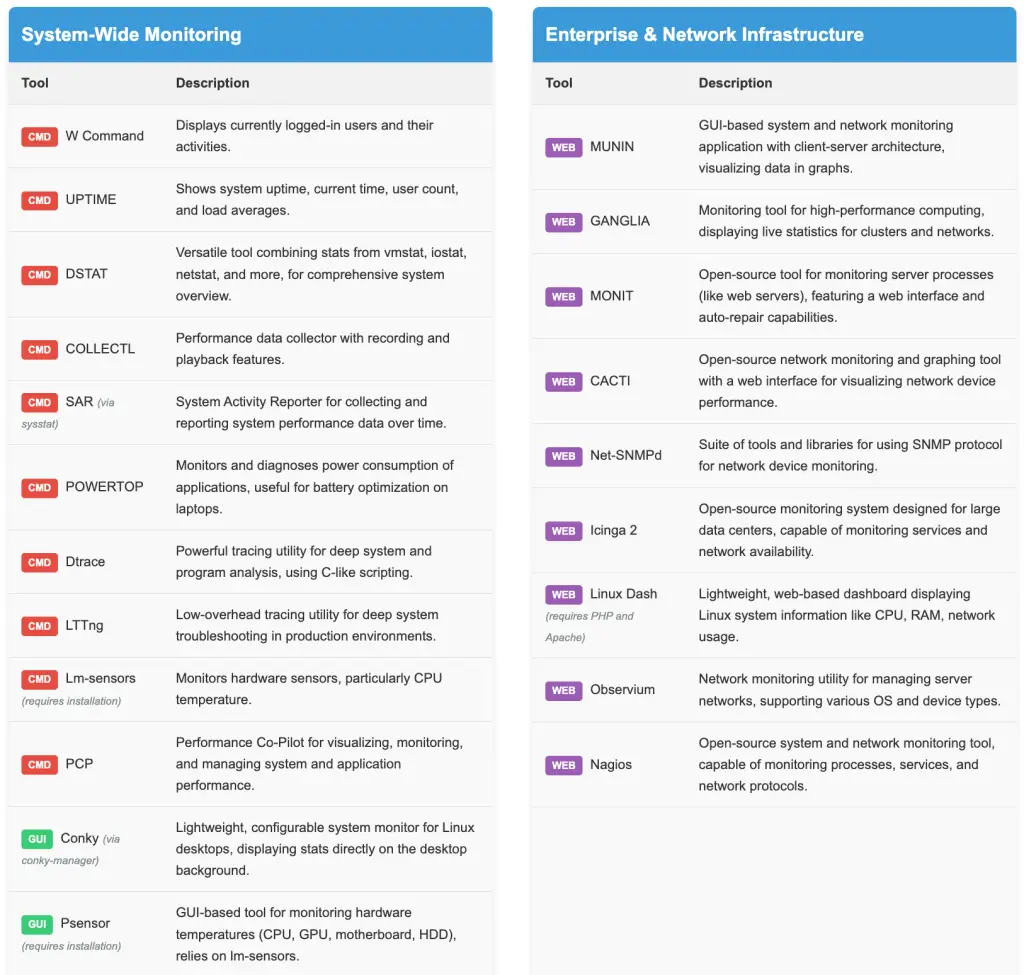
13. MUNIN – Visual System and Network Monitoring
Munin offers a graphical user interface (GUI) based monitoring solution designed for both systems and networks, employing a client-server architecture. In a Munin setup, a central server (the Munin master) is configured to poll and collect monitoring data from various client machines (Munin nodes). This architecture allows for centralized monitoring of distributed systems.
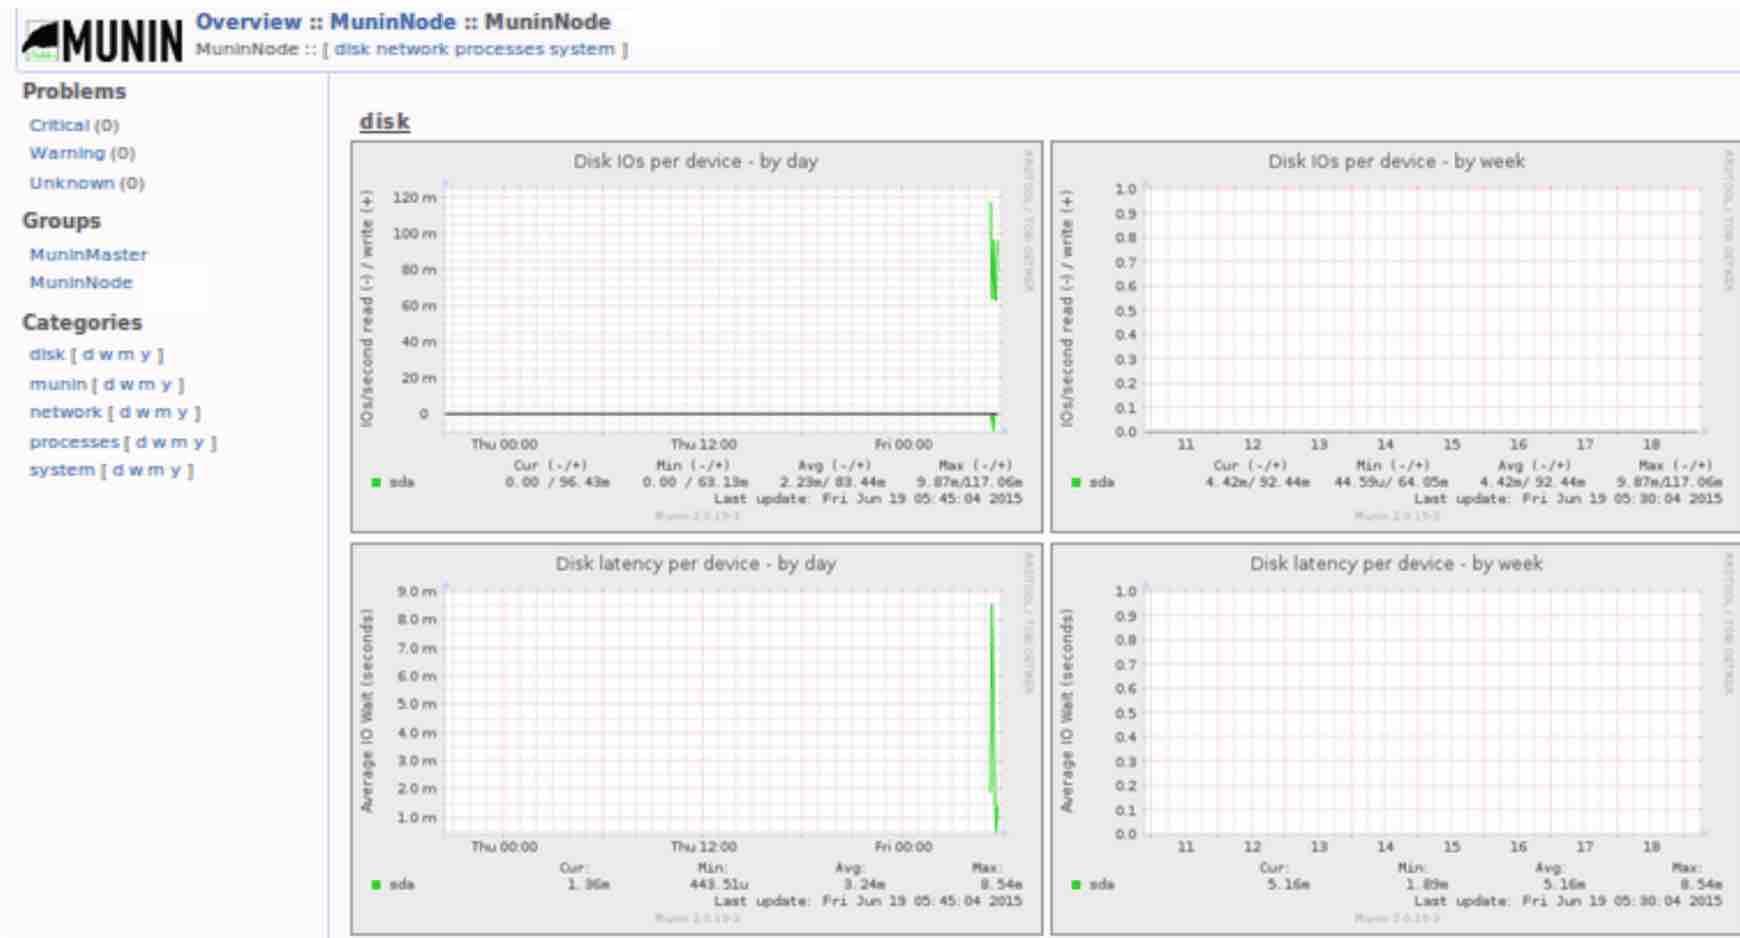
Munin web-based monitoring interface example
For detailed information about Munin’s features, configuration, and usage, you can refer to the official Munin documentation.
14. GANGLIA – Scalable Monitoring for High-Performance Computing
Ganglia is a monitoring system specifically tailored for high-demand environments such as high-performance networks, large-scale computing systems, and clusters. It excels at providing a consolidated view of real-time and historical statistics across numerous nodes, displaying key metrics like network traffic, CPU load averages, and more. Ganglia is characterized by its distributed design and scalability, making it suitable for monitoring complex and extensive infrastructures.
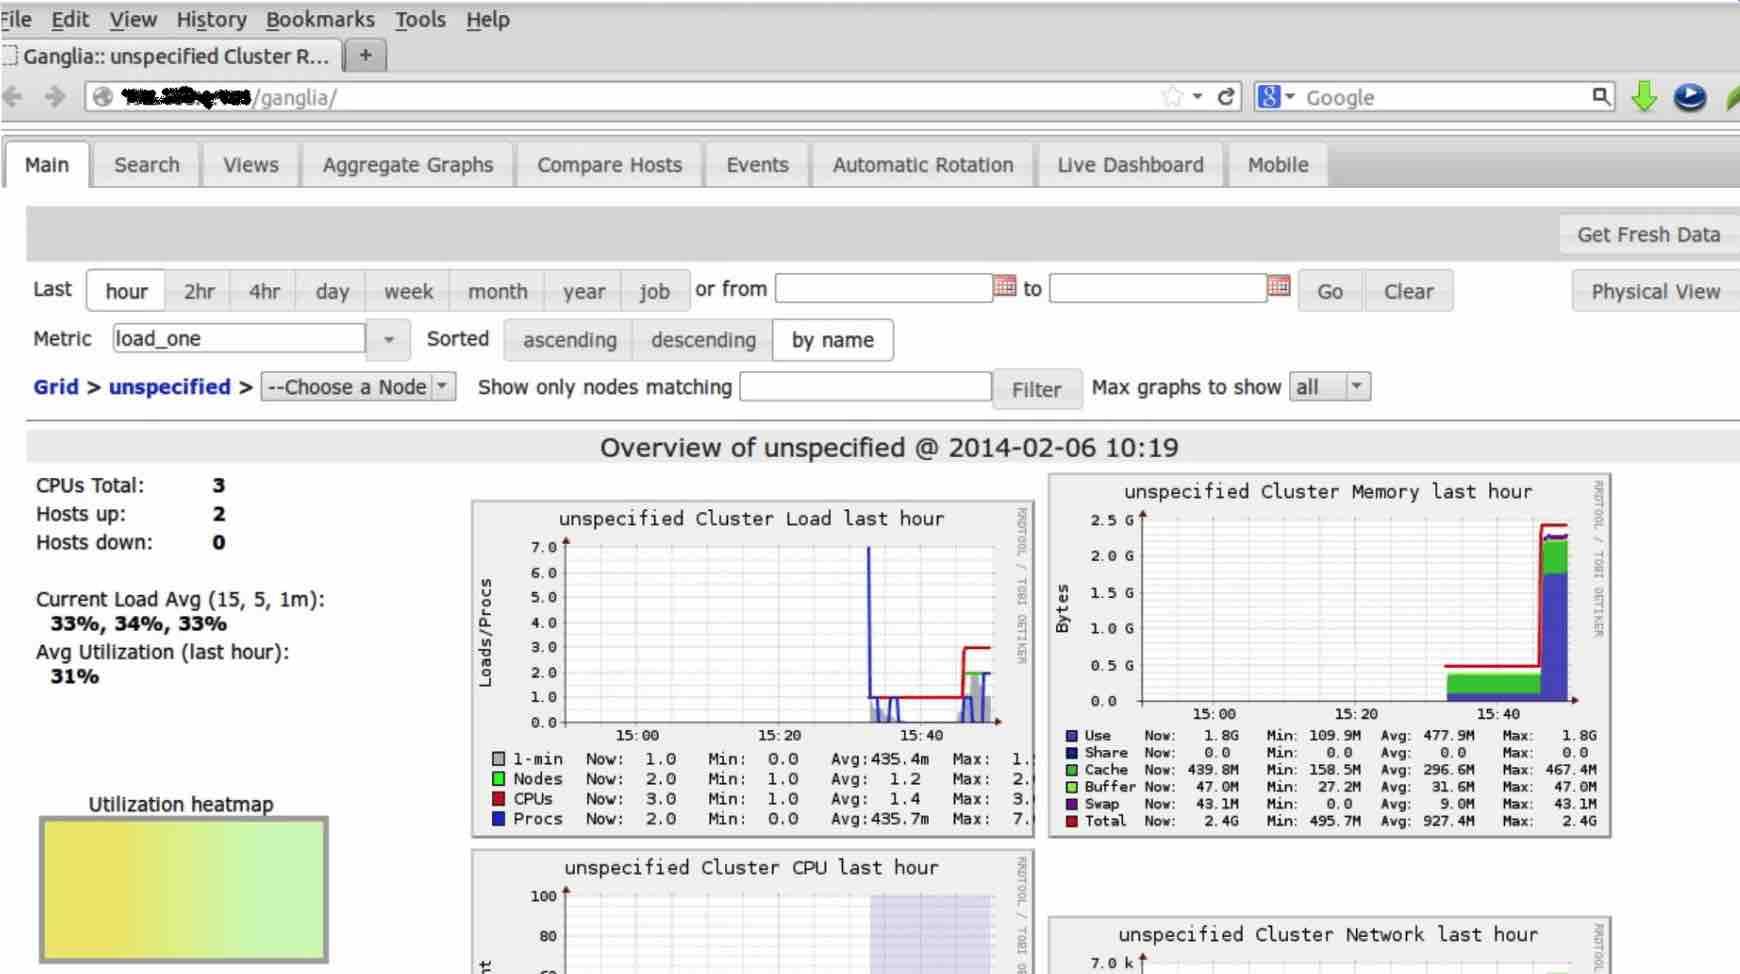
Ganglia’s user interface for monitoring high-performance computing environments
15. DSTAT – The All-in-One Resource Statistics Tool
DSTAT is engineered to provide a holistic view of system performance metrics, encompassing CPU activity, virtual memory usage, I/O device performance, and more. A key advantage of DSTAT is its versatility; it effectively integrates the functionalities of several legacy monitoring tools like iostat, ifstat, vmstat, netstat, and ifstat, offering a unified monitoring solution.
To install DSTAT on your Linux system, you can use your distribution’s package manager:
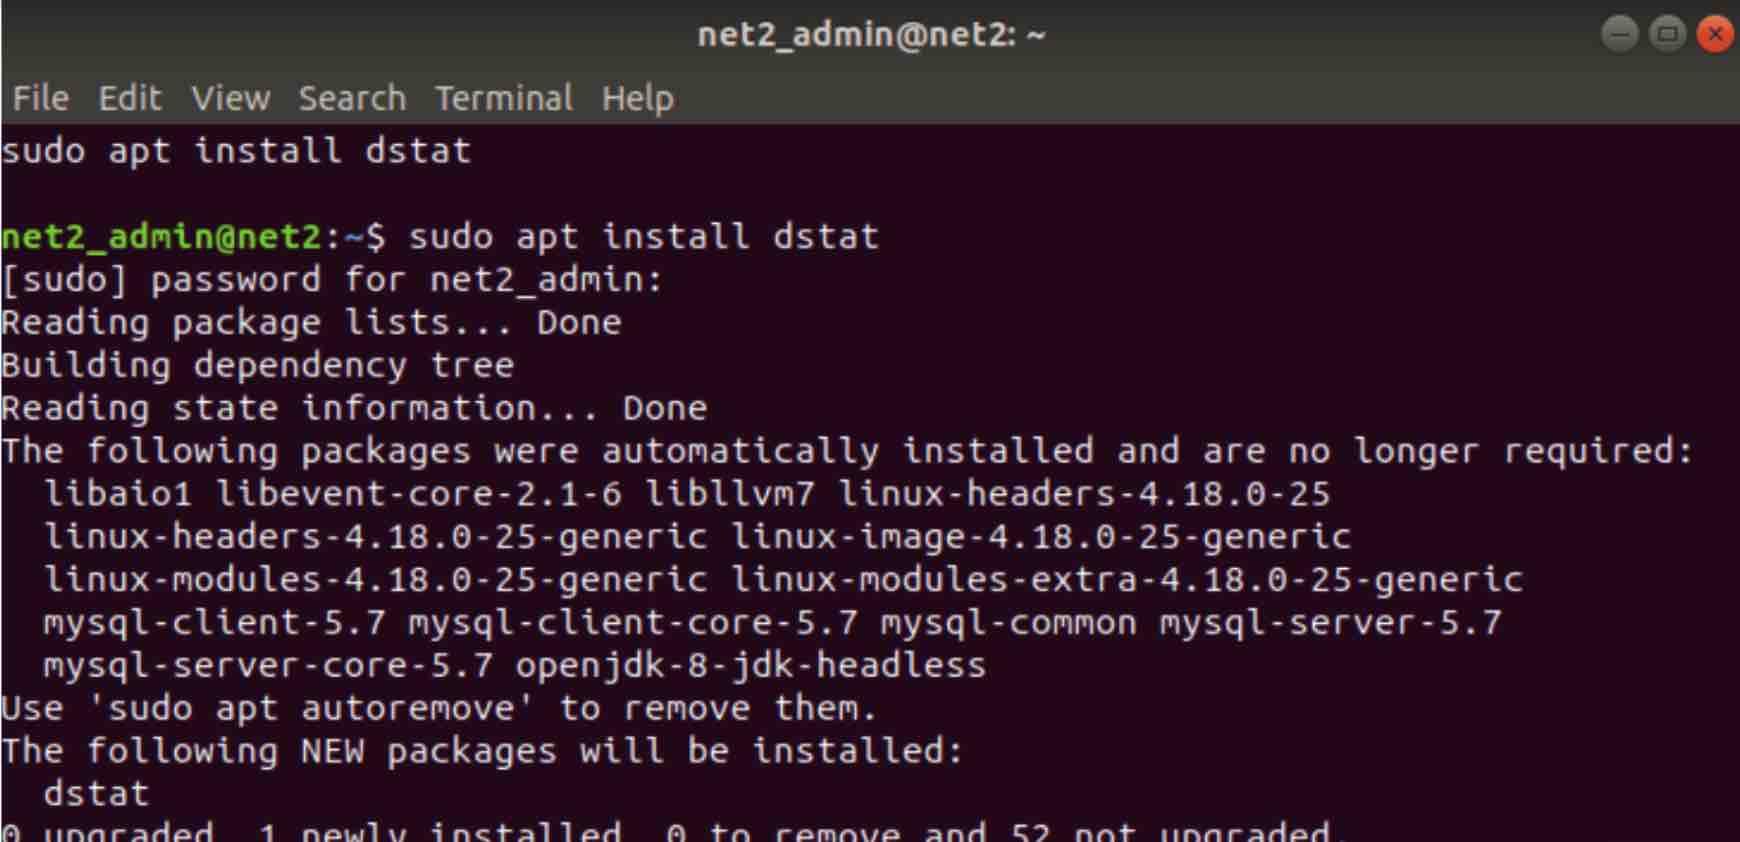
Command to install DSTAT using package manager
After successful installation, executing the dstat command in your terminal will present a dynamic output of system statistics:
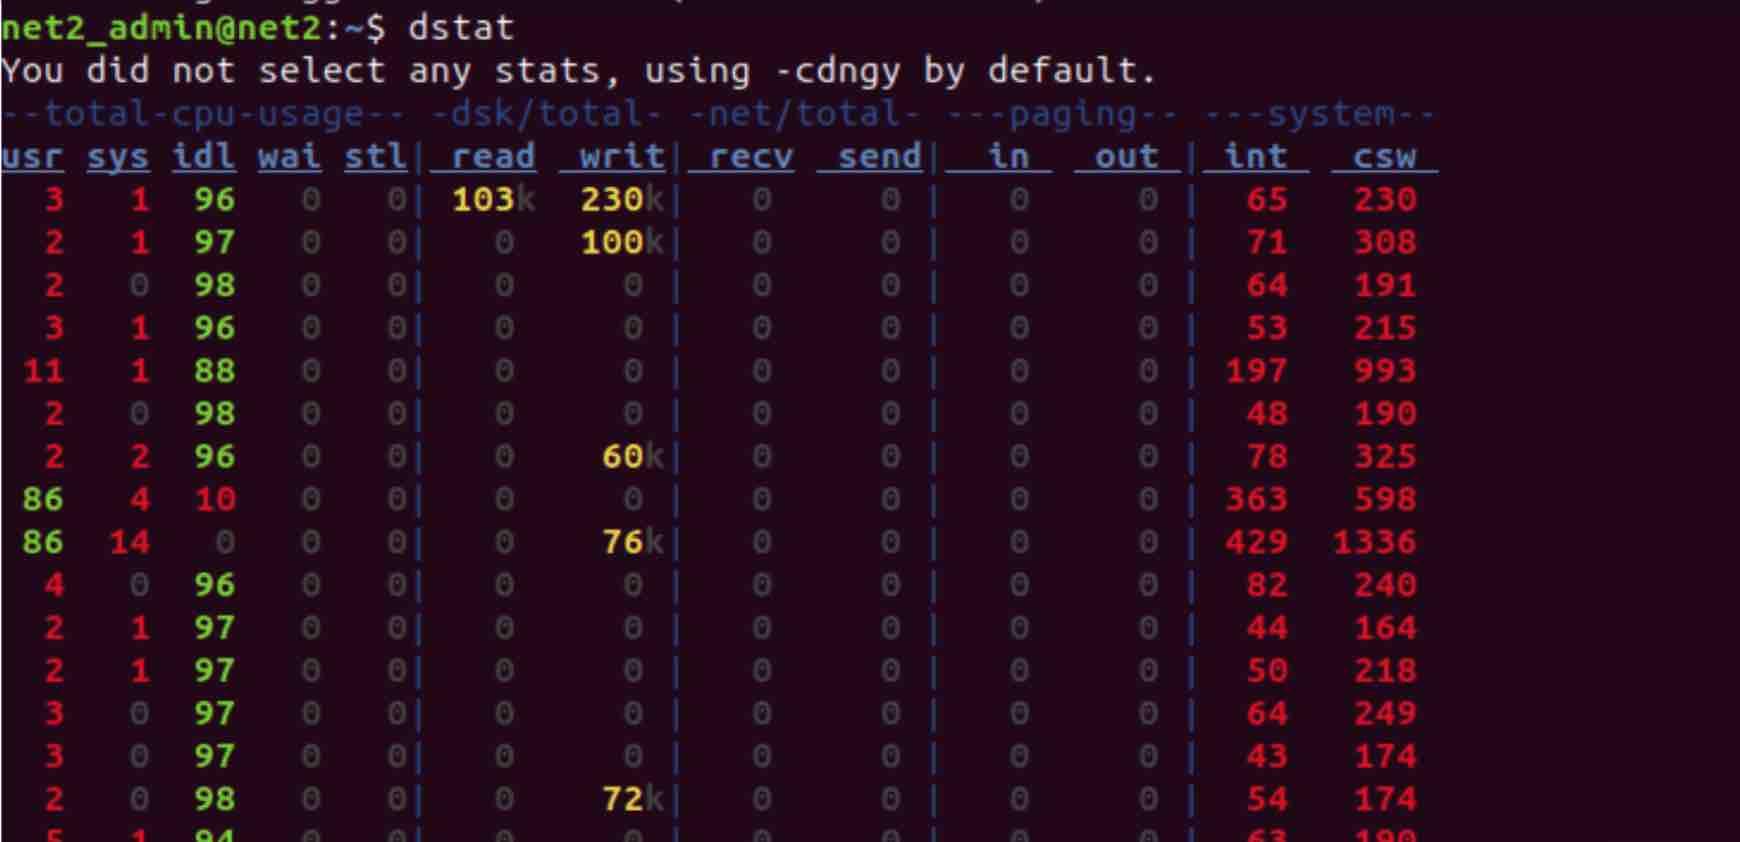
Example output from the DSTAT command, displaying various system metrics
When run without any specific options, DSTAT employs its default metric set (equivalent to -cdngy options). The standard output includes the following categories of statistics:
- CPU statistics:
Breakdown of CPU usage into time spent by user-level processes (usr), system-level processes (sys), idle time (idl), and time spent waiting for I/O operations (wai).
- Disk statistics:
Aggregated count of read and write operations performed across all disk devices.
- Network statistics:
Total data received (recv) and transmitted (send) across all network interfaces, measured in bytes.
- Paging statistics:
Number of memory paging operations, indicating memory being copied in and out of the system’s RAM (in/out).
- System statistics:
Counts of hardware interrupts (int) and context switches (csw) occurring within the system.
To suppress the initial warning message “You did not select any stats” that DSTAT sometimes displays, you can include the -a option when running the command.
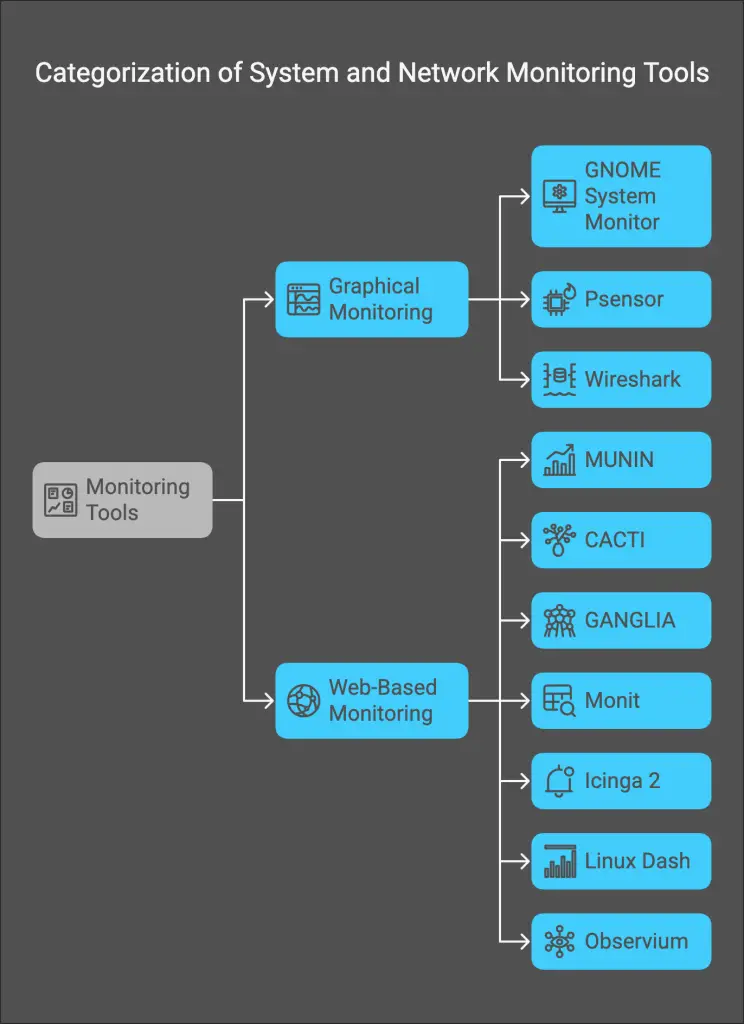
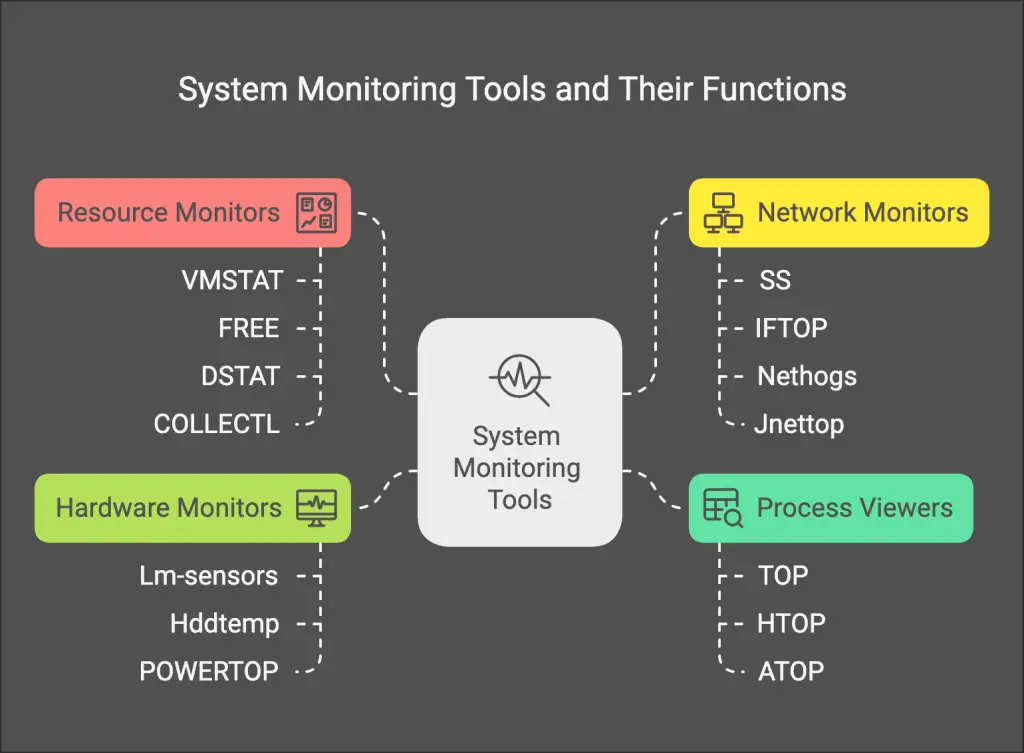
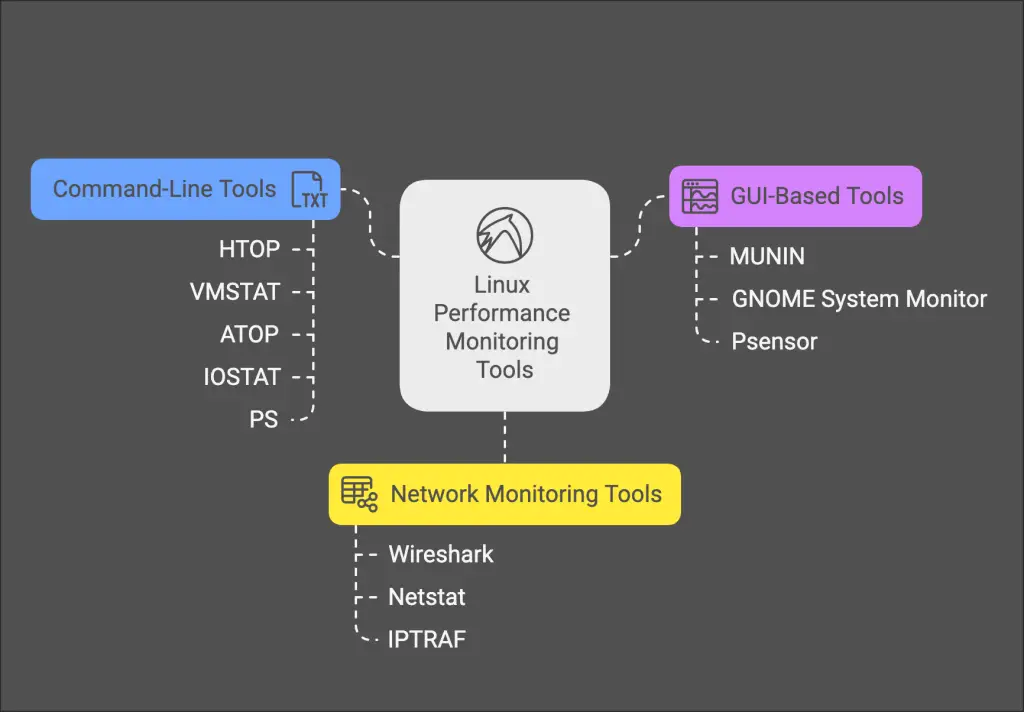
Categorization of System and Network Monitoring Tools
Read: Maximize Ubuntu 24.04 Speed and Efficiency: A Complete Tuning Guide
16. MONIT – Process Monitoring and Automated Maintenance
Monit is an open-source utility designed for proactive monitoring of server processes, encompassing critical services like web servers such as Apache and Nginx. Monit offers a lightweight, web-browser accessible interface, enabling administrators to conveniently check the status of monitored services. Beyond basic monitoring, Monit is capable of performing automated repair and maintenance actions when it detects issues, enhancing system resilience.
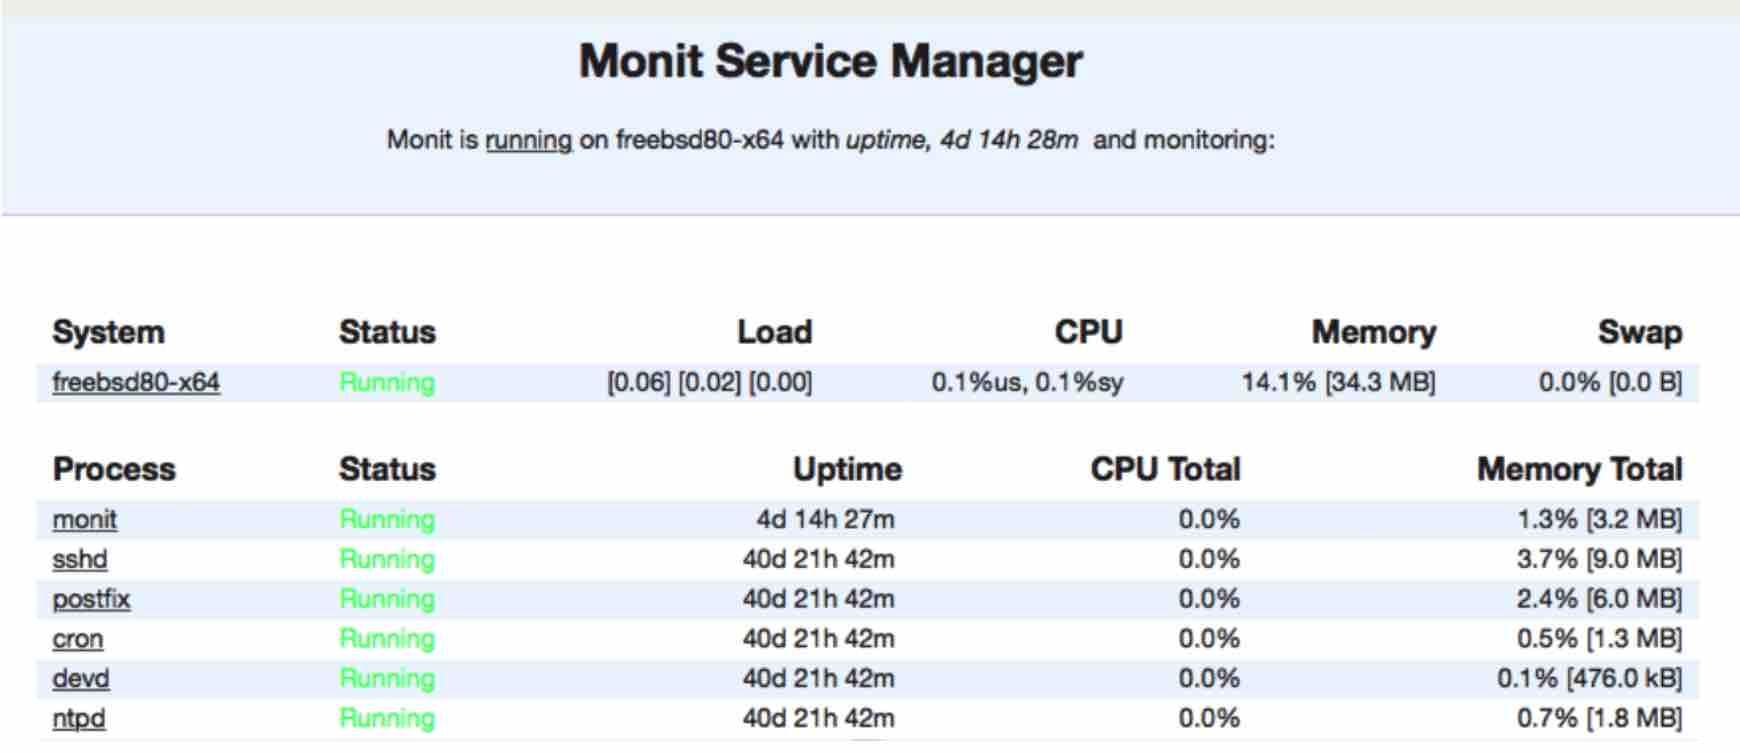
Monit’s web interface for process monitoring and management
17. COLLECTL – In-Depth Performance Data Collection
Collectl is a versatile Linux performance monitoring tool focused on gathering extensive data about the current state of a system. This open-source, command-line utility shares similarities with other monitoring commands like ps, vmstat, and top but expands upon their capabilities by offering built-in features for data logging and playback. Collectl is designed to operate with minimal overhead, typically incurring a CPU usage impact of less than 0.1%, making it efficient for continuous monitoring and historical analysis.
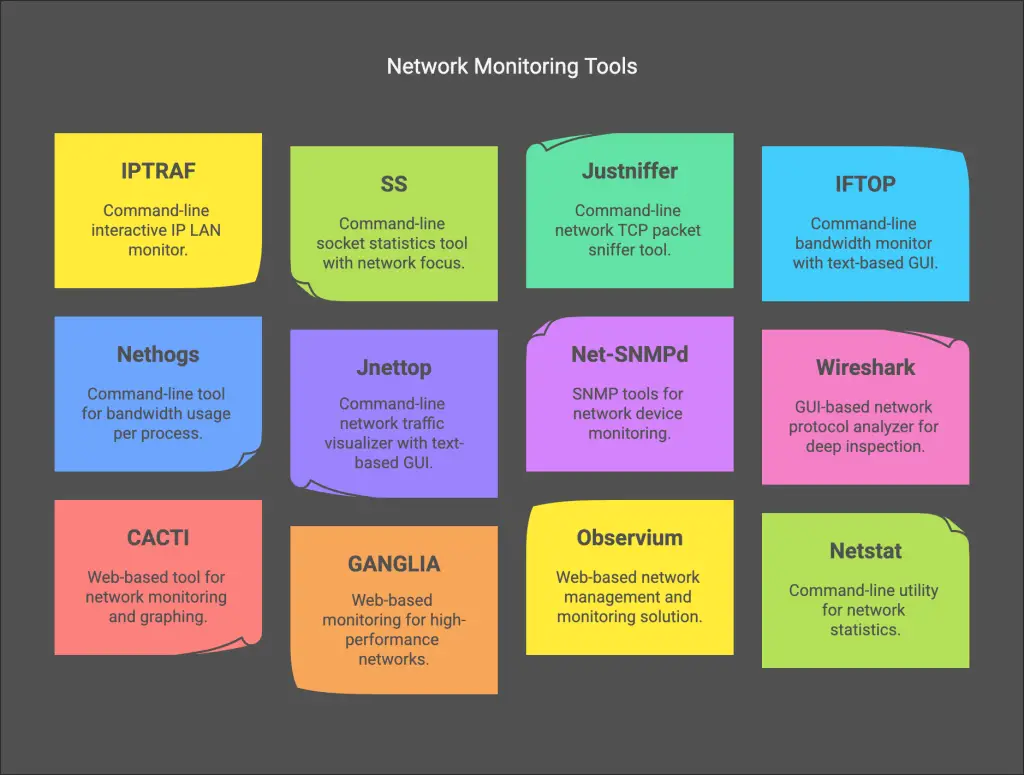
Overview of Network Monitoring Tools
18. PMAP – Examining Process Memory Maps
PMAP, or Process Memory Map, is an open-source utility focused on inspecting the memory allocation of running processes. It allows administrators to examine the complete address space of specific processes, providing a detailed map of memory segments and their usage. Originally developed for Sun OS, PMAP retains some functionality within Linux environments, although its capabilities are somewhat limited compared to its original form. Despite these limitations, it remains a valuable tool for in-depth memory usage analysis of individual processes.
19. SAR – System Activity Reporting and Historical Analysis
SAR, the System Activity Reporter, is a powerful tool for collecting and reporting a wide range of system performance metrics. This includes detailed information on CPU performance, network monitoring data, disk utilization statistics, memory consumption, I/O device activity, battery performance (on supporting systems), and more. SAR can generate performance reports in real-time, providing immediate insights into system behavior. Furthermore, it offers the capability to store collected data to files, enabling historical performance analysis and trend identification using the -o filename option.
To begin using SAR, you’ll first need to install it on your system. This is typically done using the system’s package manager:
sudo apt install sysstatAfter installation, for Ubuntu-based systems, you need to enable data collection by modifying the /etc/default/sysstat configuration file. Within this file, set the ENABLED variable to "true" to activate SAR’s data gathering functionalities.
20. CACTI – Web-Based Network Monitoring and Graphing
Cacti is an open-source network monitoring and graphing tool designed to visualize network performance. It is particularly well-suited for monitoring network infrastructure components such as routers, switches, and servers. Cacti features a user-friendly web-based interface, making it accessible for configuration and administration by end-users with varying levels of technical expertise. A key strength of Cacti is its ability to generate visual representations of network performance data through graphs, facilitating trend analysis and issue identification.
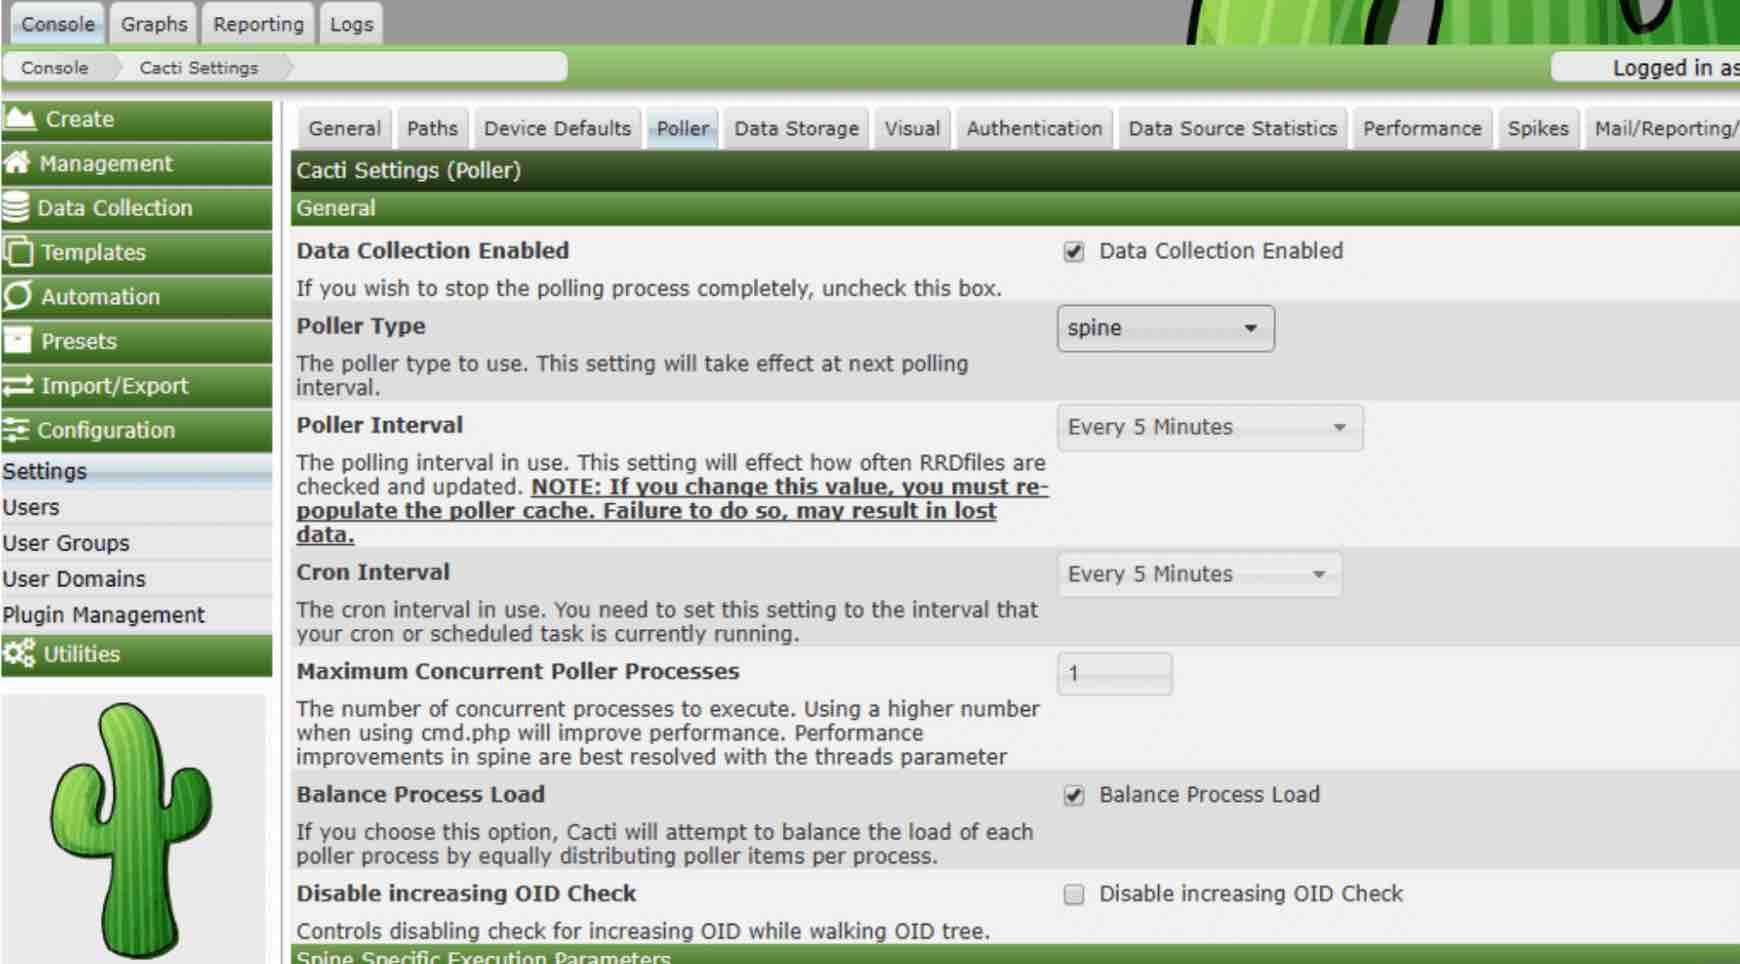
Cacti’s web-based user interface for network monitoring
Below is an example of a performance graph generated by Cacti, illustrating network performance metrics over time:
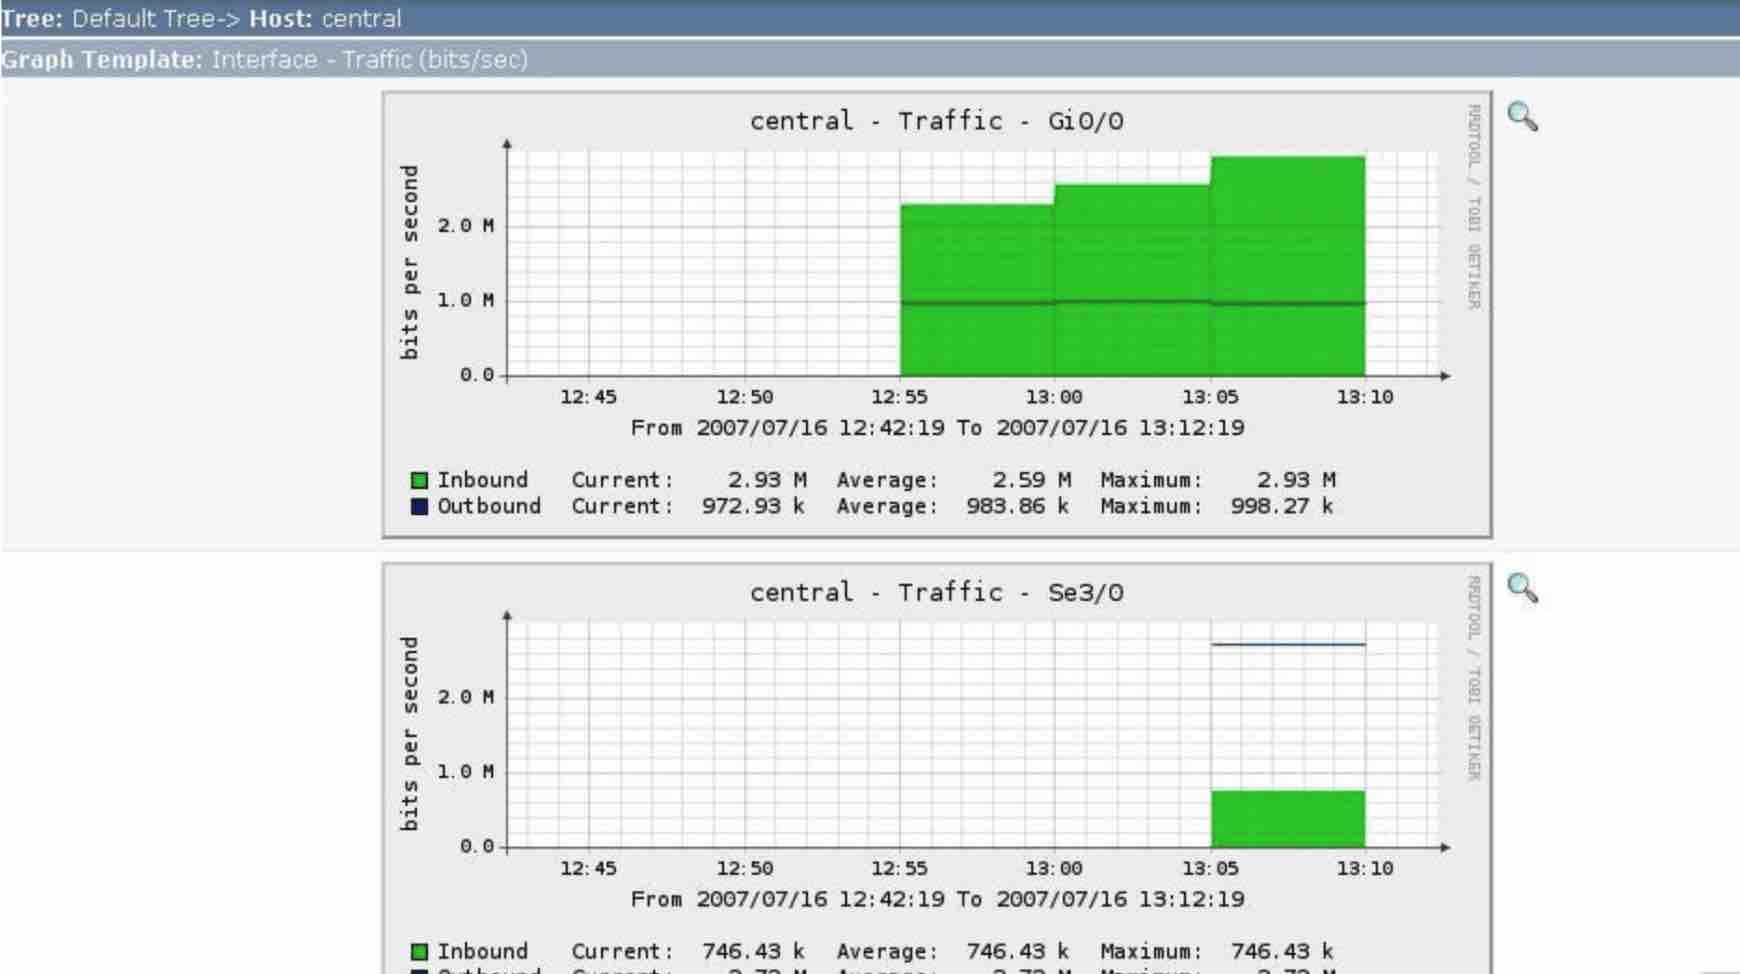
Example of a performance graph generated by Cacti
21 – IFtop – Command-Line Bandwidth Usage Monitor for Network Speeds
IFtop (Interface TOP) distinguishes itself as yet another indispensable command-line utility specifically engineered to provide real-time insights into network bandwidth usage. Its primary function is to furnish users with granular information pertaining to network speeds and traffic flow across designated network interfaces. IFtop has garnered widespread adoption and recognition as one of the preeminent network bandwidth monitoring tools available for Linux-based systems. Akin to the previously discussed htop utility, IFtop typically necessitates a preliminary download and installation phase before it can be effectively employed. To initiate the installation of IFtop, it is imperative to first ensure the presence of essential prerequisite libraries, namely libpcap and libncurses. This can be readily accomplished by executing the subsequent command within your terminal environment:
sudo apt install libpcap0.8 libpcap0.8-dev libncurses5 libncurses5-dev
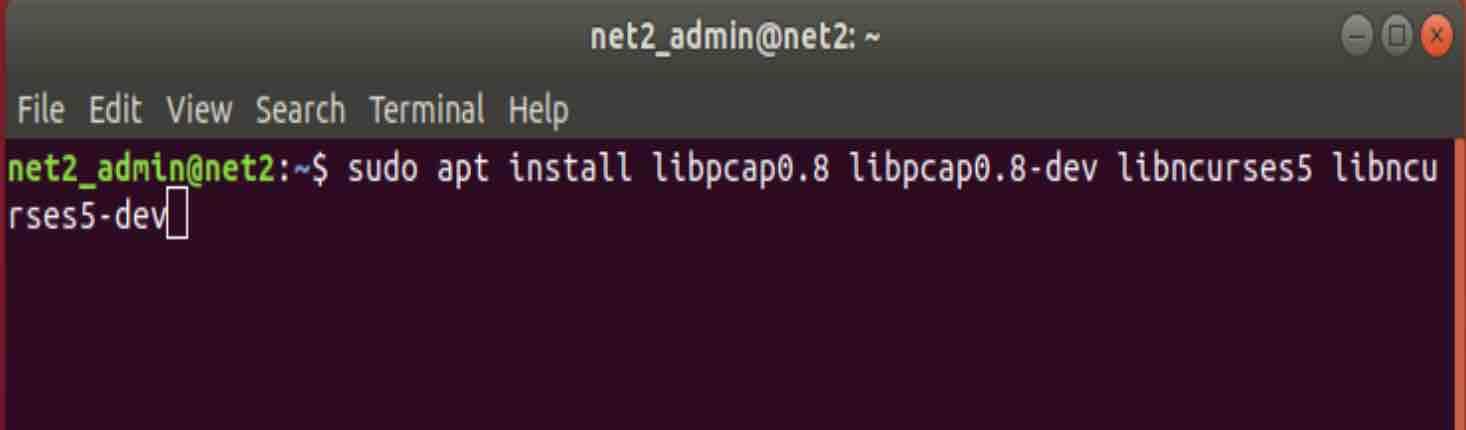
Command to install libpcap and libncurses prerequisites for IFtop
Following the successful installation of the prerequisite libraries, proceed to install the IFtop utility itself by issuing the subsequent command in your terminal:
sudo apt install iftop
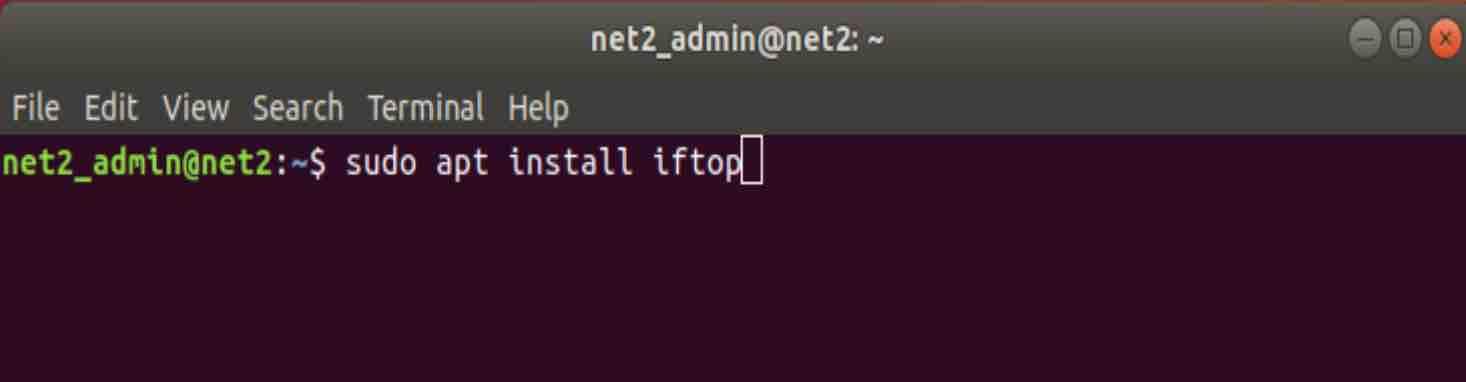
Command to install IFtop using package manager
Once the installation process is finalized, you can readily launch IFtop and initiate network bandwidth monitoring by simply executing the command iftop within your terminal environment:
iftop
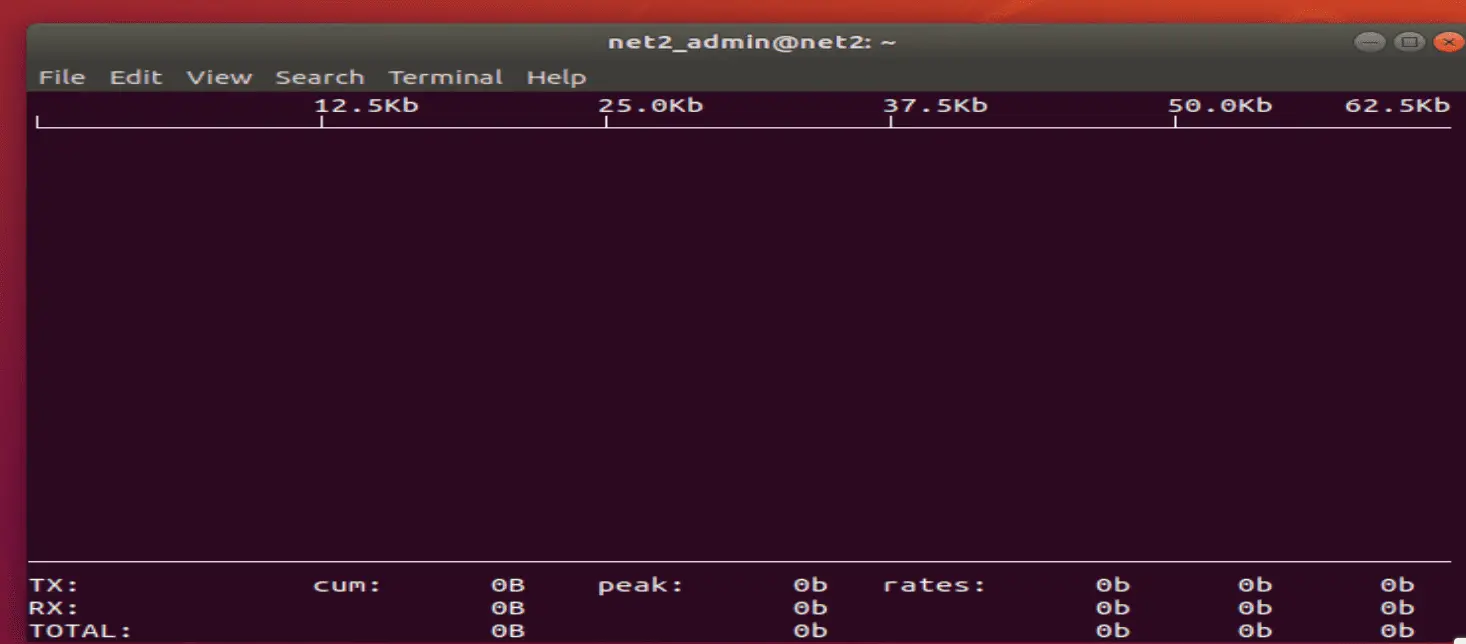
Executing the IFtop command for real-time bandwidth monitoring
22. POWERTOP – Linux Power Consumption Analysis
PowerTOP is a specialized command-line diagnostic tool designed to monitor and analyze the electrical power consumption of applications running on battery-powered Linux devices, such as laptops. When used interactively, PowerTOP allows system administrators and users to fine-tune power management settings and identify applications that are disproportionately consuming power. This capability is particularly useful for extending battery life on portable Linux systems by optimizing power usage.
To install PowerTOP on your Linux system, use the appropriate package management command:
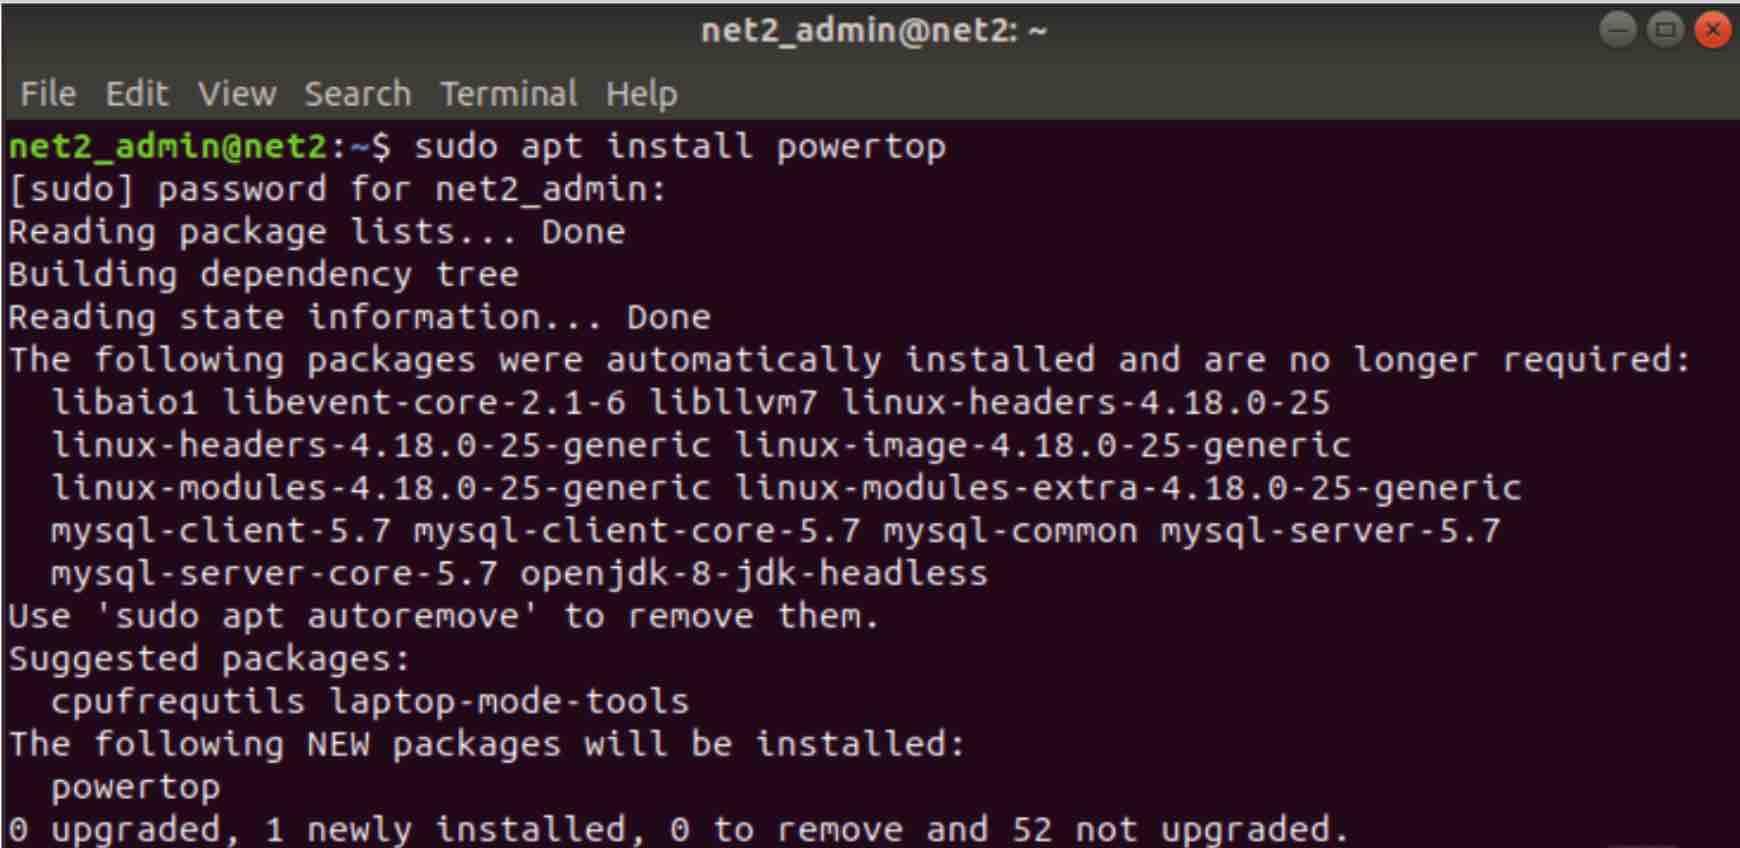
Command for installing PowerTOP
After installation, PowerTOP is typically run with administrative privileges to access system-level power consumption data:
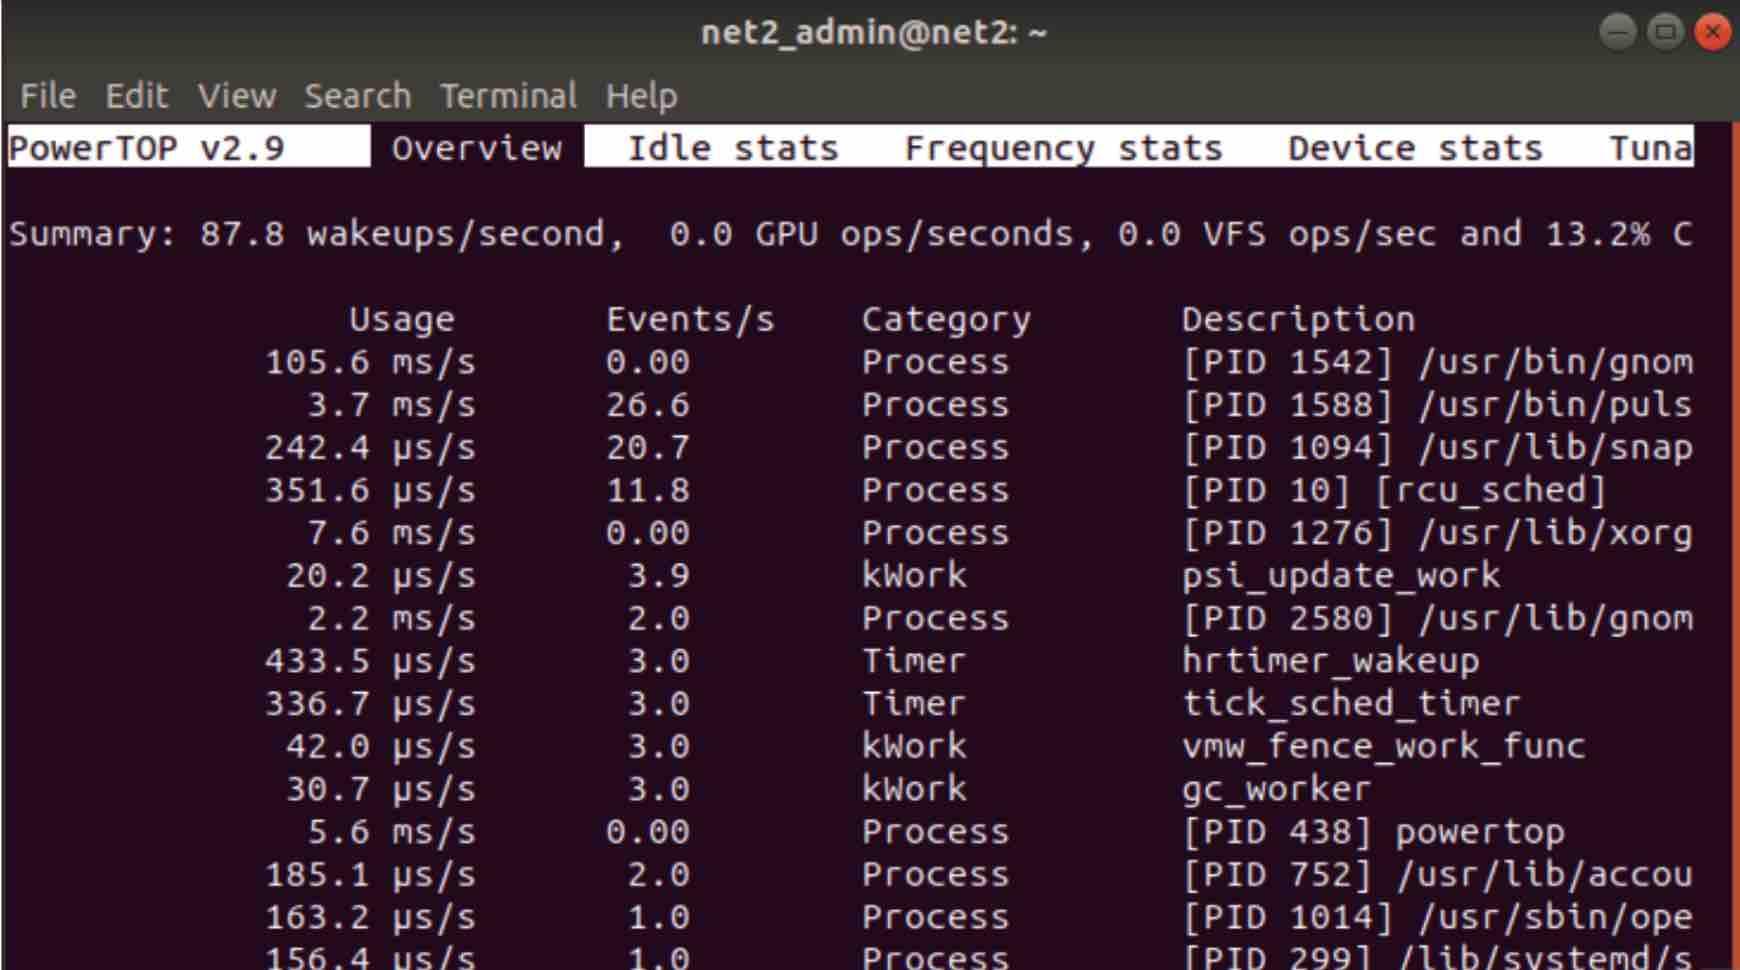
PowerTOP interactive interface for power consumption analysis
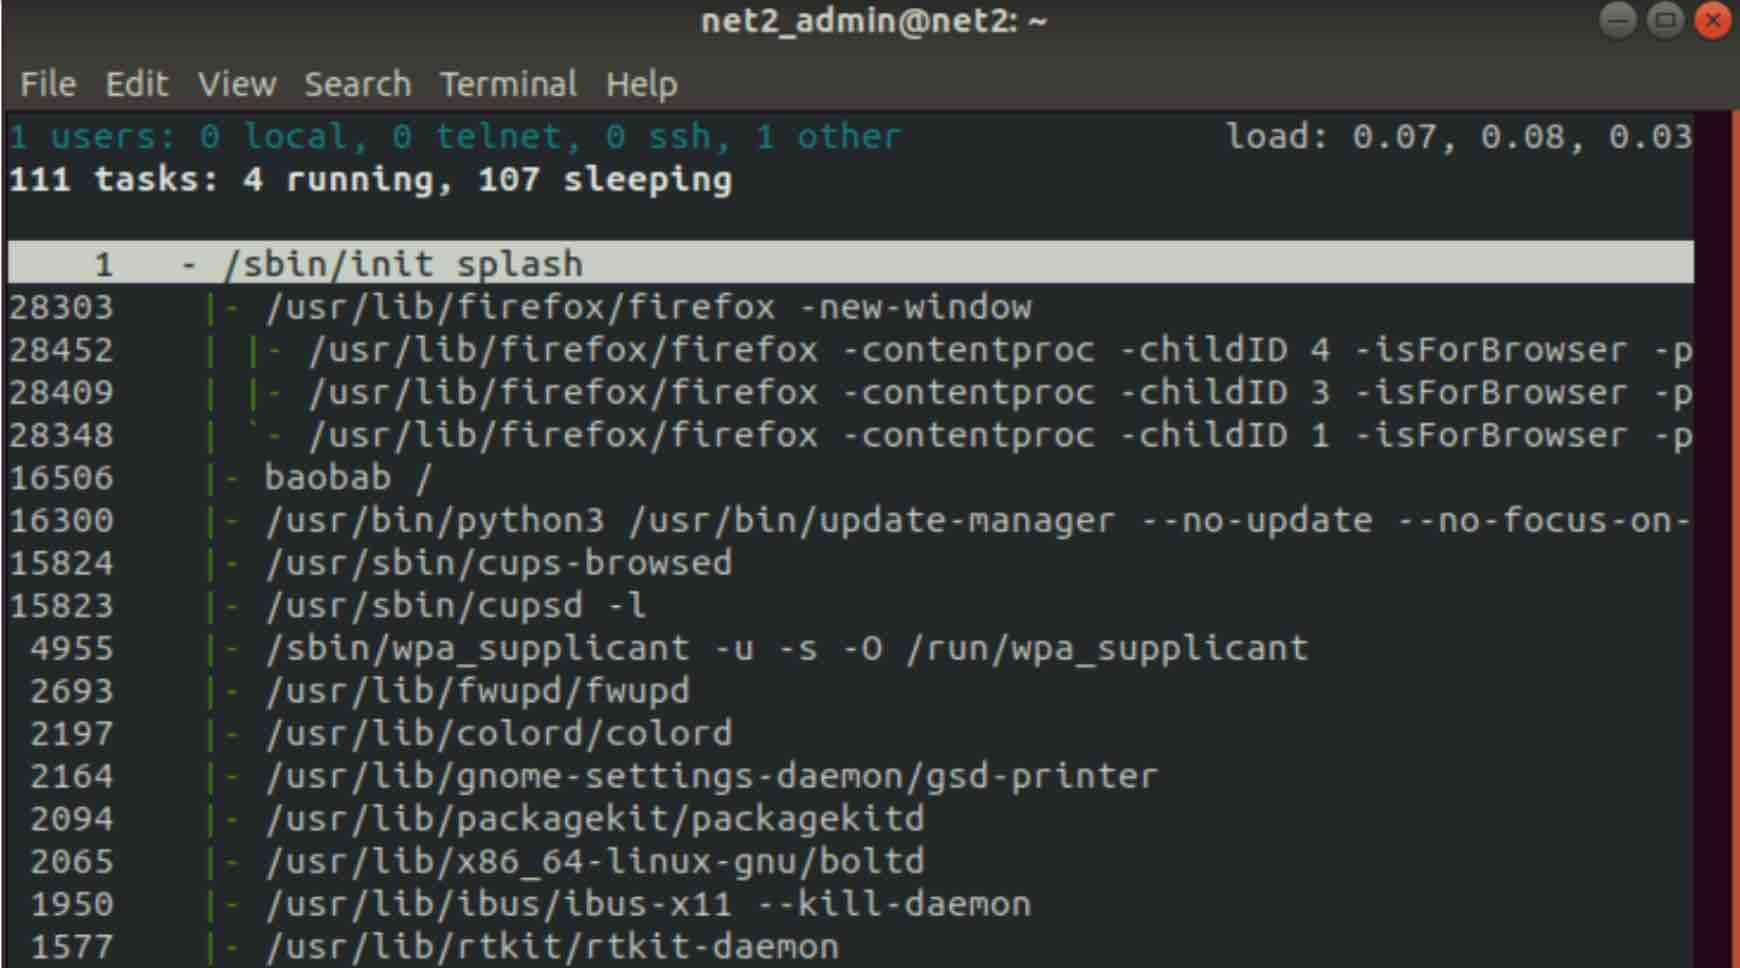
23 – WHOWATCH – Interactive User and Process Monitoring
Whowatch is a command-line utility that provides an interactive way to monitor and view information about users currently logged into a Linux system, along with their active processes. This user-friendly tool offers similar functionality to the standard w command but presents the information in a more dynamic and interactive format, enhancing real-time monitoring of user activity.
Whowatch is not typically pre-installed on Linux distributions, so you’ll need to install it using your system’s package manager:
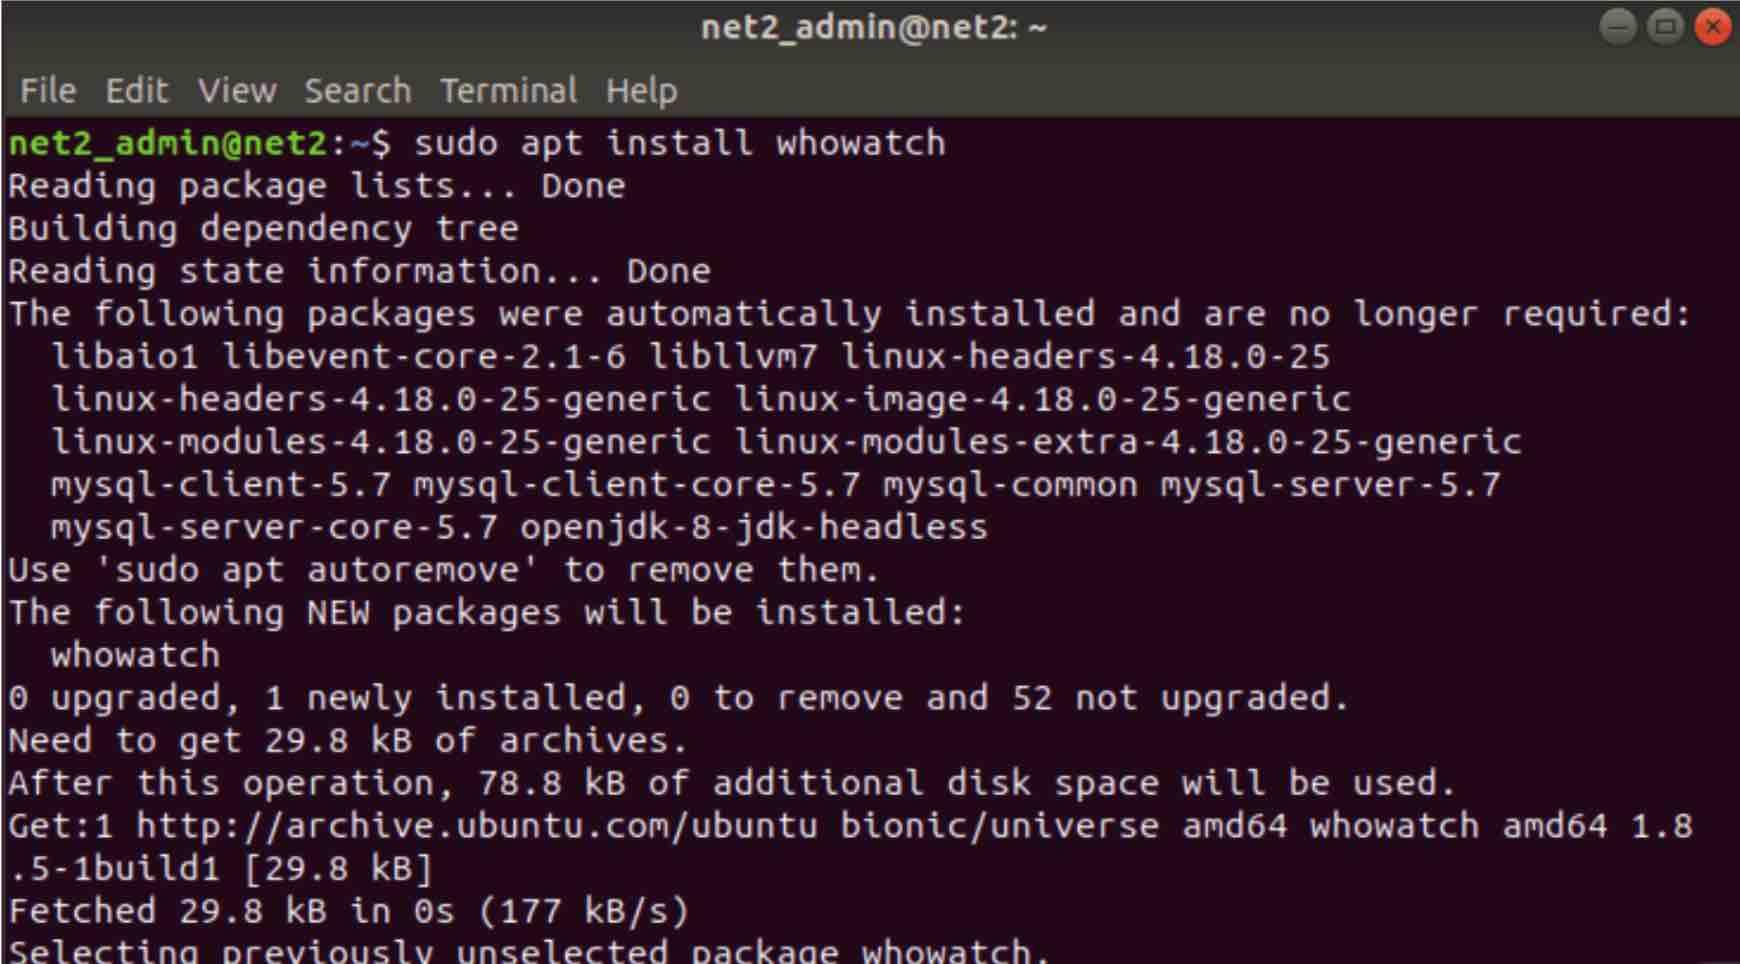
Command to install Whowatch
To launch the Whowatch application, simply execute the command whowatch in your terminal:
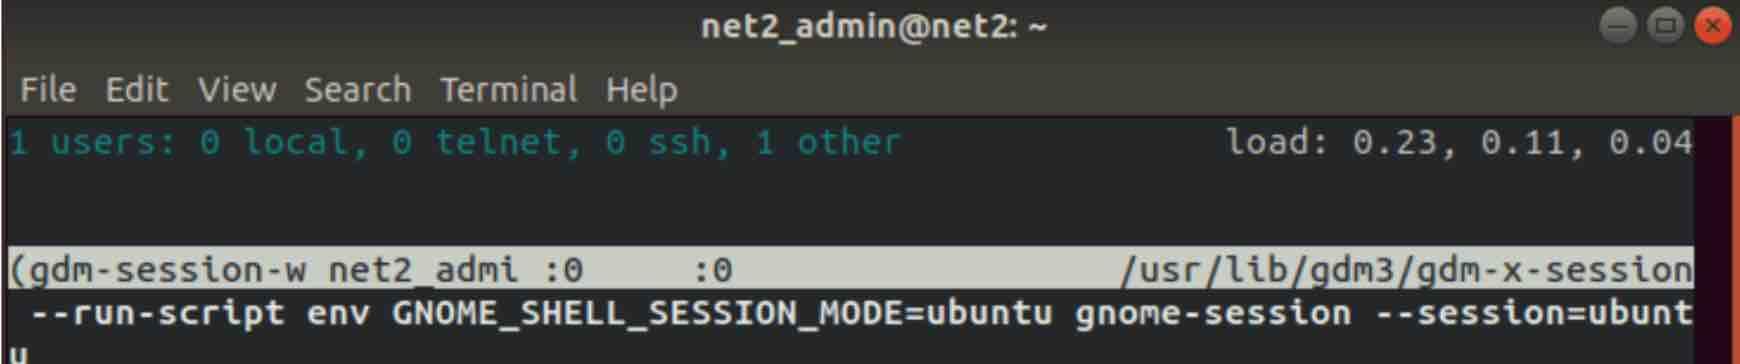
Executing the Whowatch command
As illustrated in the output, Whowatch provides a summary of currently logged-in users, categorized by connection type (e.g., SSH, telnet), along with the total number of active users.
To view a detailed list of all processes associated with Linux users, press the 't' key within the Whowatch interface:
Whowatch display showing all user processes
Whowatch is also capable of displaying system uptime, user login names, hostnames, TTY information, process details, and connection types. Additionally, it allows you to select a specific user to examine a tree-like representation of their related processes, facilitating detailed user-specific process analysis.
To access comprehensive Linux system information within Whowatch, simply press the 's' key:
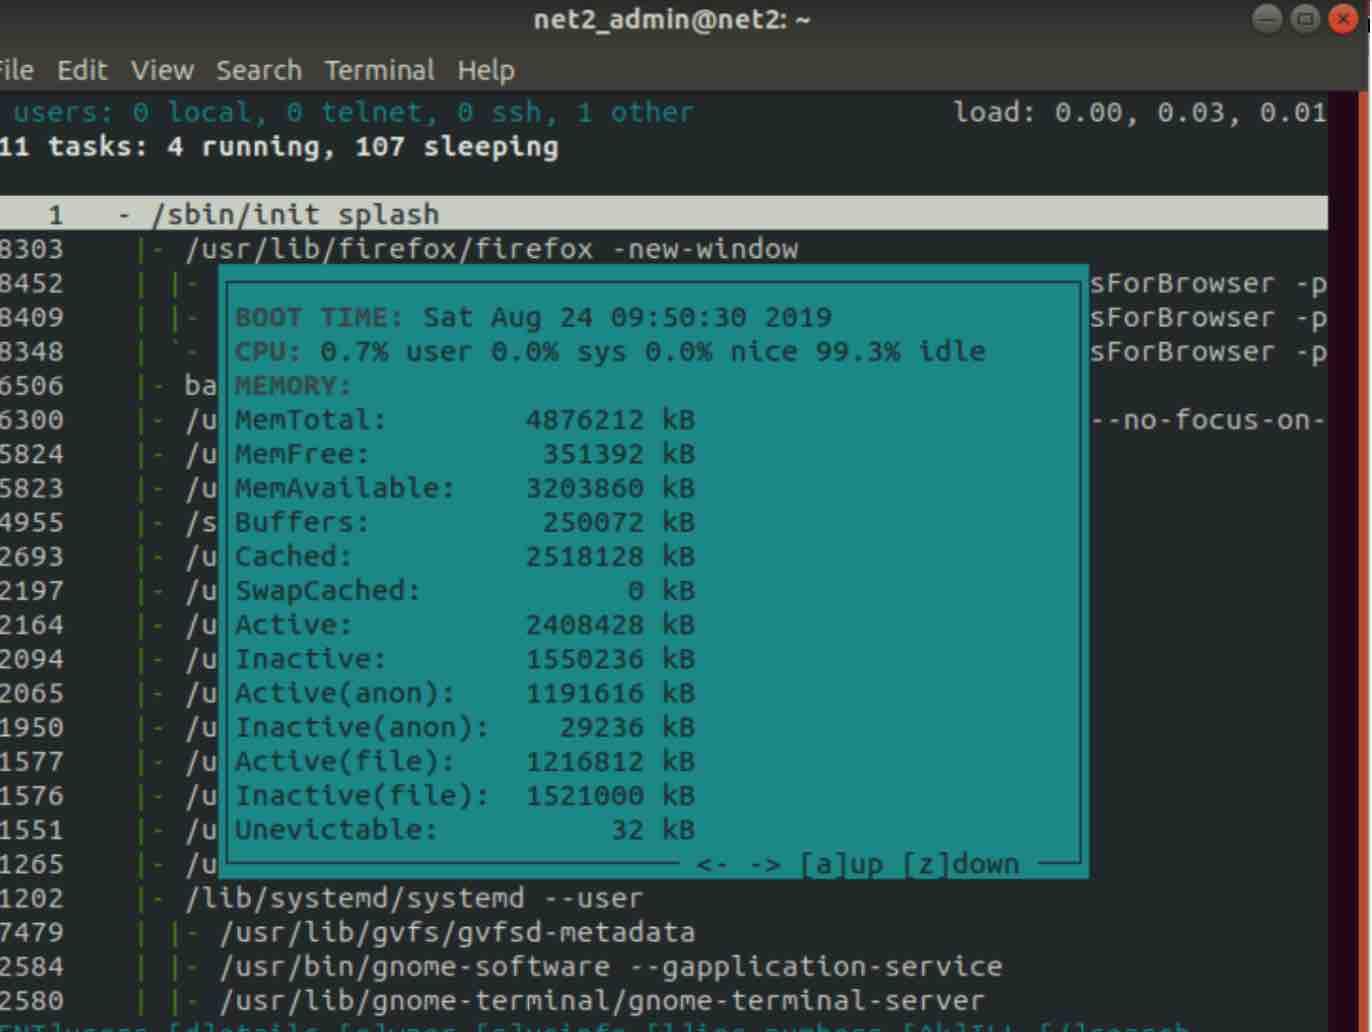
Whowatch displaying Linux system information
Read: Network configuration in Ubuntu
24 – dtrace – Advanced Dynamic Tracing for In-Depth System Analysis
The DTrace tool is a sophisticated dynamic tracing framework designed for troubleshooting complex issues in Linux systems. It offers unparalleled detailed views into the operation of programs and the system kernel. DTrace provides a powerful scripting language, similar to C, that allows users to create event-based scripts for performing advanced system performance analysis and debugging tasks.
25 – nethogs – Real-Time Network Bandwidth Monitor per Process
Nethogs is a valuable network monitoring utility that provides real-time insights into network bandwidth usage. It is particularly useful for diagnosing network traffic issues. If you experience an unexpected surge in network activity, Nethogs can quickly help you identify the specific process that is responsible for consuming excessive bandwidth, allowing for prompt problem resolution.
You can install Nethogs on your Linux system using the following command in your terminal:
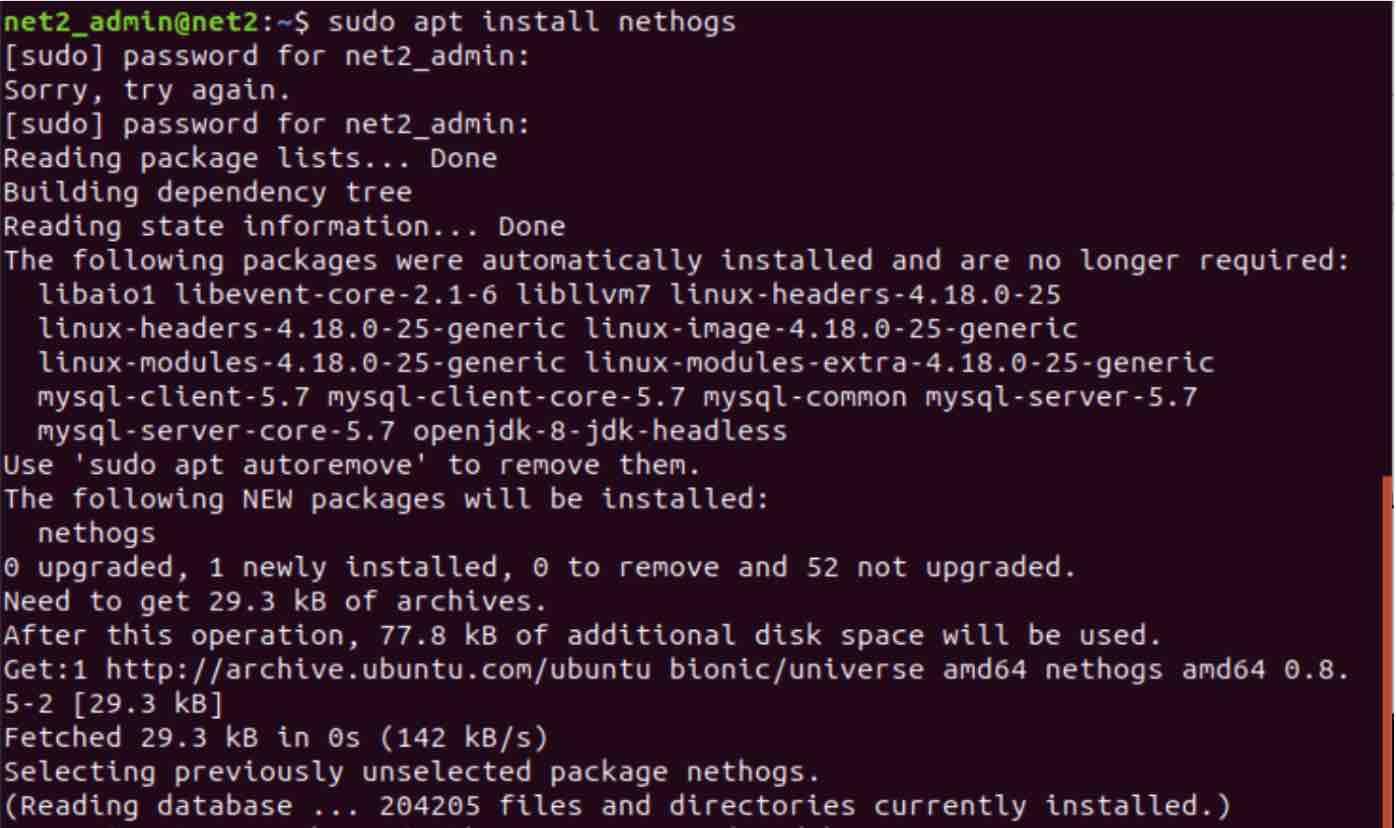
Command to install Nethogs using package manager
To start Nethogs and begin monitoring your network bandwidth, simply run the command sudo nethogs in your terminal. Administrative privileges are required to capture network traffic information.
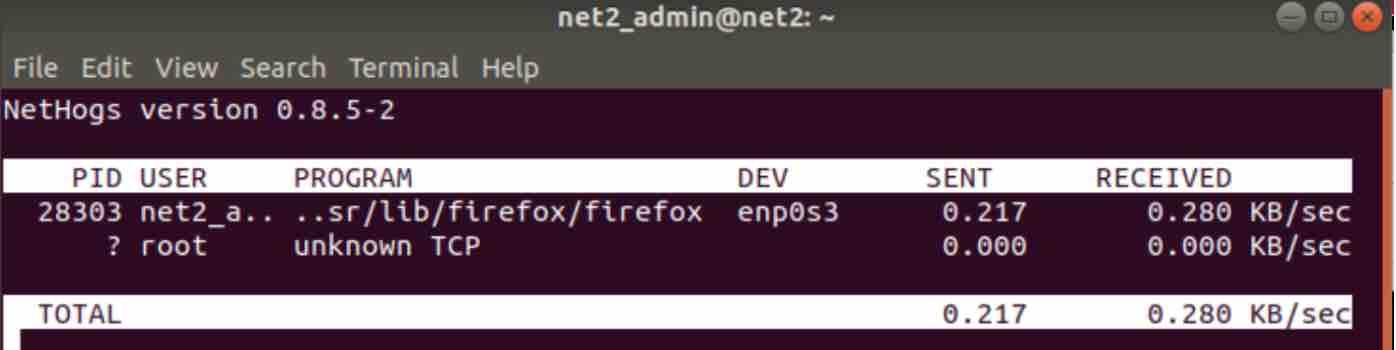
Executing the Nethogs command for real-time network monitoring
For detailed information about the various options and functionalities of the Nethogs command, you can access its manual page by typing man nethogs in your terminal.
26 – iotop – Linux Disk I/O Monitoring Tool for Process-Level Analysis
Iotop, conceptually similar to the top command, is an open-source utility specifically designed for monitoring disk input/output (I/O) usage on Linux systems. It provides a dynamic, real-time display of I/O utilization, broken down by individual threads and processes. System administrators will find Iotop invaluable for identifying processes that are exhibiting unusual or excessive disk read and write activity, which can be indicative of performance issues or bottlenecks.
As Iotop is not typically installed by default on Linux distributions, you will need to install it using your system’s package manager. The installation process is straightforward:
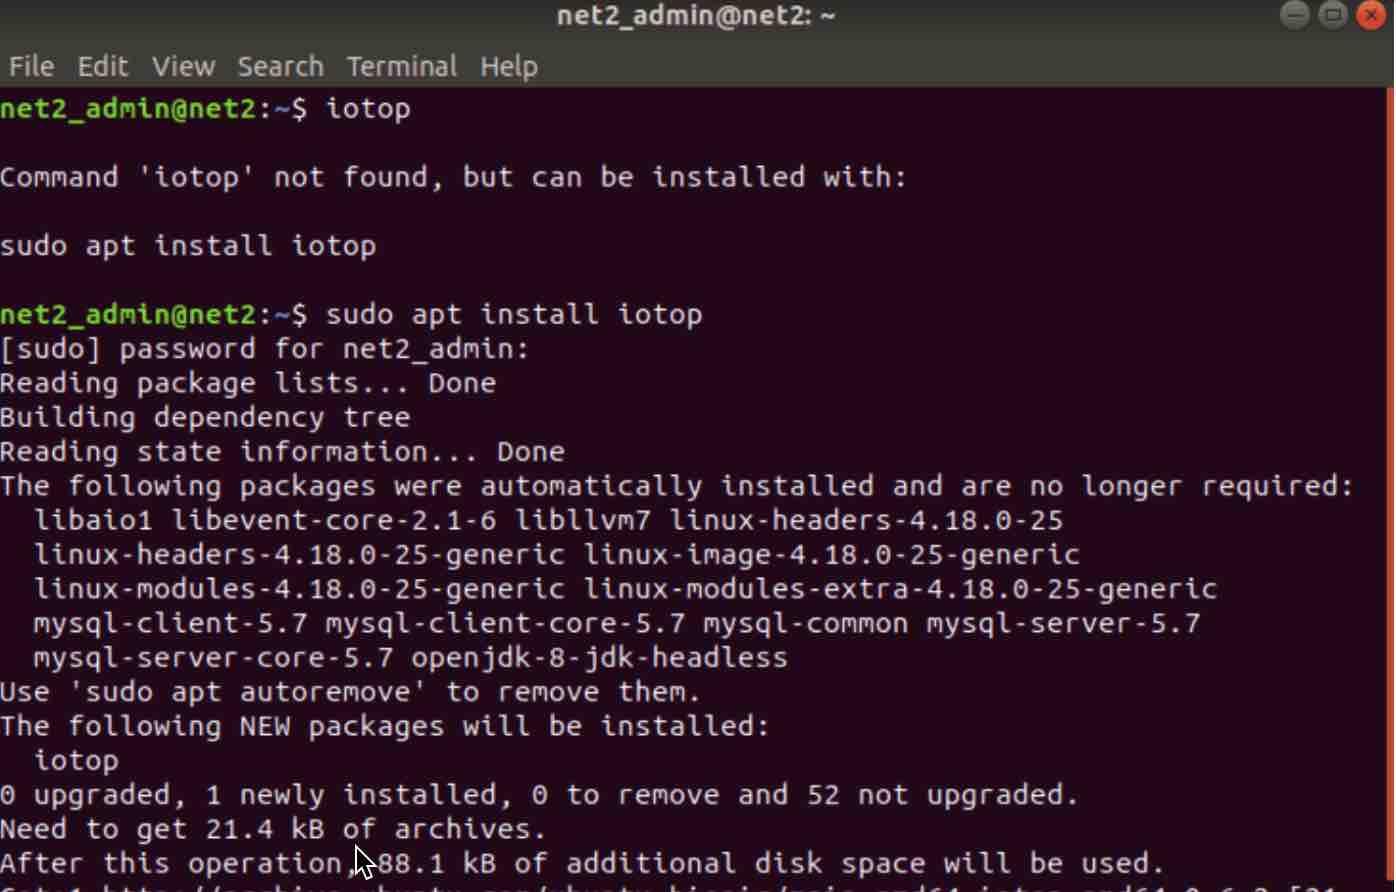
Installation command for Iotop using package manager
Once the installation is complete, you can launch Iotop by issuing the command sudo iotop in your terminal. Administrative privileges are necessary to monitor system-wide I/O activity.
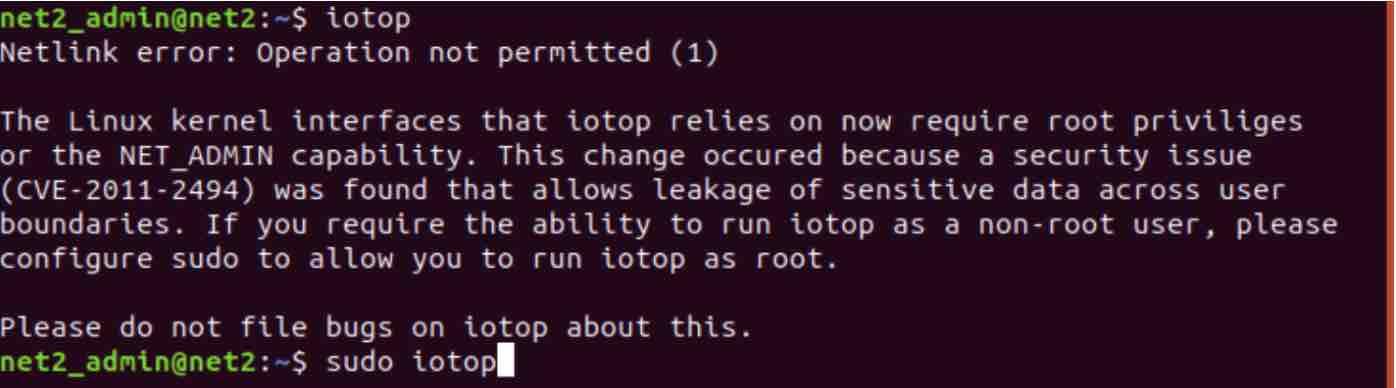
Running the Iotop command to monitor disk I/O in real-time
The output of the sudo iotop command will be displayed in your terminal, providing a live view of disk I/O activity per process:
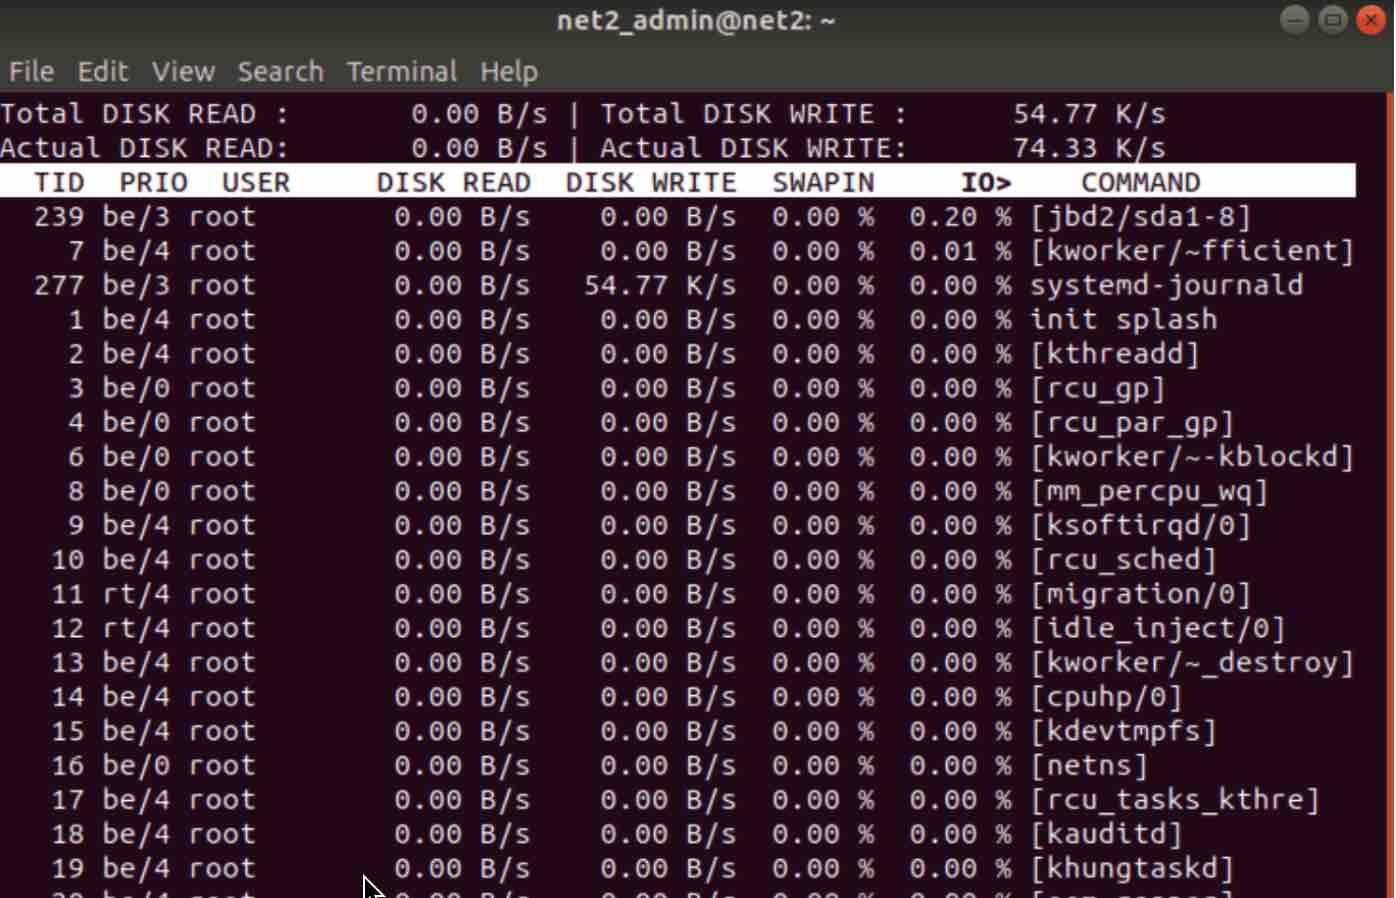
Iotop output showing disk I/O statistics per process and thread
If you wish to focus solely on processes or threads that are currently engaged in I/O operations, you can use Iotop with the -o or --only option. This will filter the output to display only active I/O entities.
In the Iotop output, the “IO>” column represents the total I/O operations performed by each process, encompassing both direct disk I/O and swap usage.
The “SWAPIN” column provides specific details about swap usage for each process, indicating the extent to which processes are utilizing swap space.
27 – jnettop – Network Statistics and Bandwidth Monitoring Tool
If you need to gain insights into network statistics and bandwidth consumption patterns, jnettop is a highly effective tool. For users who prefer a graphical user interface, jnettop-gui is available, offering a Java-based frontend for jnettop. System administrators will find jnettop particularly useful for quickly assessing the overall state of the network and tracking bandwidth usage on a per-application basis.
Below is an example of the output generated by jnettop when monitoring network traffic:
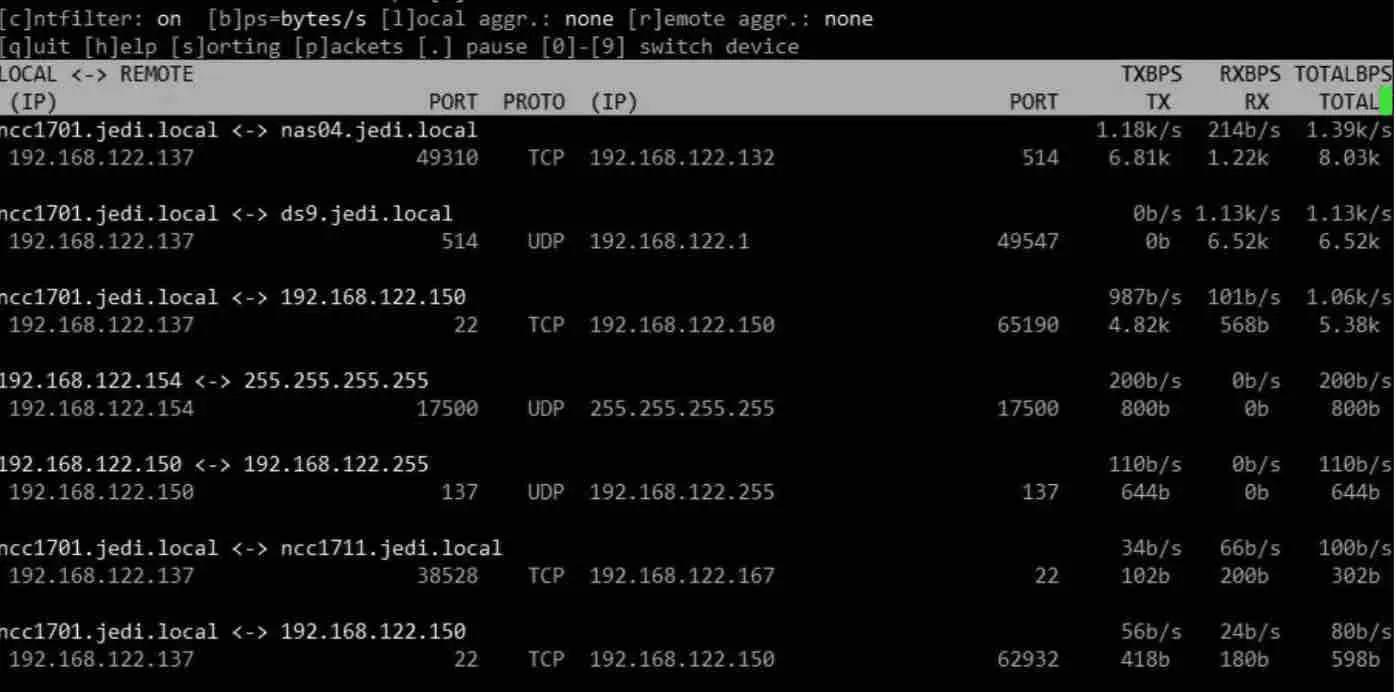
Jnettop example output showing network bandwidth usage
28 – lttng – Low-Overhead Tracing Utility for Linux Systems
LTTng (Linux Trace Toolkit Next Generation) is a powerful and efficient tracing utility meticulously engineered to assist developers in the challenging task of identifying and resolving elusive, hard-to-debug issues within production Linux environments. It is intentionally designed as a low-overhead tool, ensuring minimal disruption to the system being traced, which makes it exceptionally well-suited for deployment in diverse operational settings. LTTng can be readily installed on the majority of prevalent Linux distributions through standard package managers and is primarily controlled via a command-line interface. This versatile toolkit empowers users to initiate and configure multiple tracing sessions concurrently, as well as to record numerous traces simultaneously, all while offering a comprehensive array of configuration options to precisely tailor tracing activities to specific diagnostic requirements.
29 – net-snmpd – SNMP Agent for Network Device Monitoring and Management
Net-SNMP (Network Simple Network Management Protocol) comprises a collection of libraries and utilities that are essential for utilizing and deploying the widely adopted SNMP protocol. SNMP plays a pivotal role in monitoring network-connected devices, encompassing a broad spectrum of equipment such as switches, routers, servers, and a multitude of other network infrastructure components. The Net-SNMP suite incorporates Perl and Python modules, command-line applications, a versatile client library, a fully functional SNMP agent (net-snmpd), and a range of supplementary components, collectively providing a comprehensive toolkit for robust network monitoring and management capabilities.
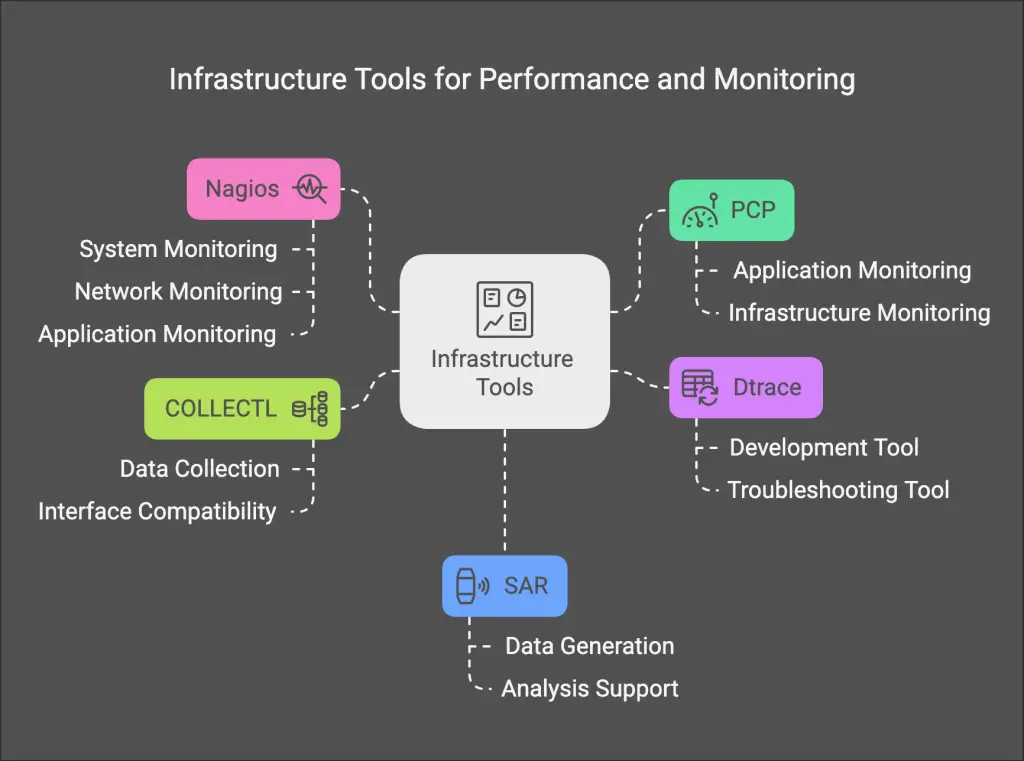
Categorization of Infrastructure Tools for Performance and System Monitoring
30 – pcp – Performance Co-Pilot for Holistic System Monitoring
PCP (Performance Co-Pilot) is a robust and versatile open-source application infrastructure meticulously designed for visualizing, comprehensively monitoring, diligently recording, effectively diagnosing, and precisely controlling the intricate activity, operational status, and overall performance characteristics of a wide range of computing resources. This encompasses individual computers, complex networks, distributed servers, and sophisticated applications. PCP stands out by delivering a highly centralized and scalable monitoring solution, making it particularly well-suited for deployment within demanding enterprise-level system environments where unified, cohesive monitoring is paramount.
31 – Wireshark – Open Source Network Protocol Analyzer for Troubleshooting
Wireshark is a renowned free and open-source network protocol analyzer, widely utilized for a diverse array of network-related tasks, including meticulous network troubleshooting, in-depth network connection monitoring, rigorous analysis of network packets (encompassing the identification of dropped packets), and proactive identification of potentially malicious activities transpiring within the network. By employing Wireshark, network administrators and security professionals gain invaluable capabilities to scrutinize network traffic at a granular level and perform thorough deep packet inspection, enabling effective network management and security vigilance.
To install Wireshark on your Linux system, you will typically use your distribution’s package manager. The installation command is generally straightforward:
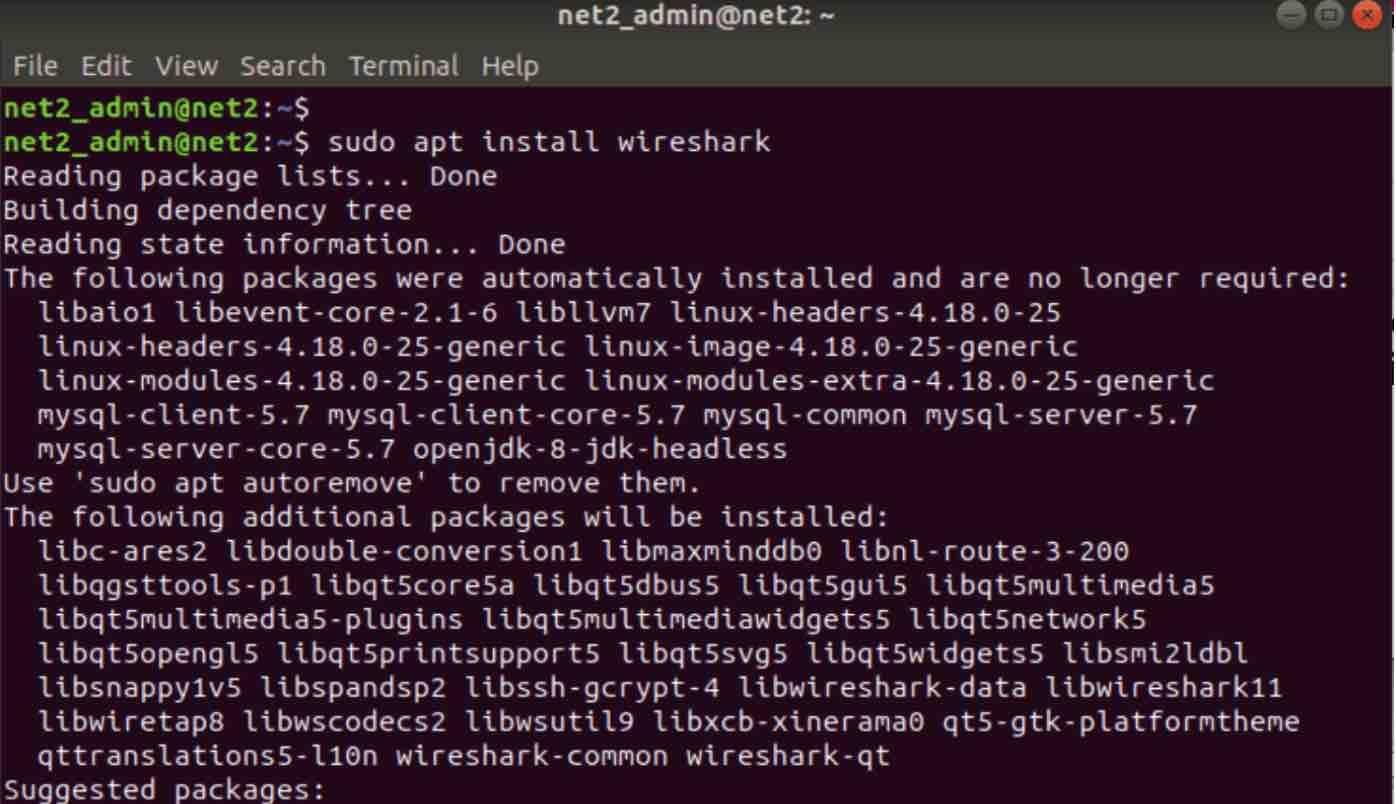
Installation command for Wireshark using package manager
Once the installation process is successfully completed, you can readily launch Wireshark directly from your terminal. Simply enter the command wireshark, and the application’s graphical user interface will appear:

Wireshark main window upon initial launch
To initiate the capture of network traffic, a user-friendly approach is to first select the specific network interface you wish to monitor from the available options presented in the Wireshark interface. Subsequently, you can commence the packet capture process by clicking on the prominent “Start” toolbar button, easily identifiable by its distinctive shark fin shape. Upon clicking this button, a dedicated window will materialize, dynamically displaying the captured network packets in real-time as they traverse the selected interface, facilitating immediate analysis and scrutiny of network communications.
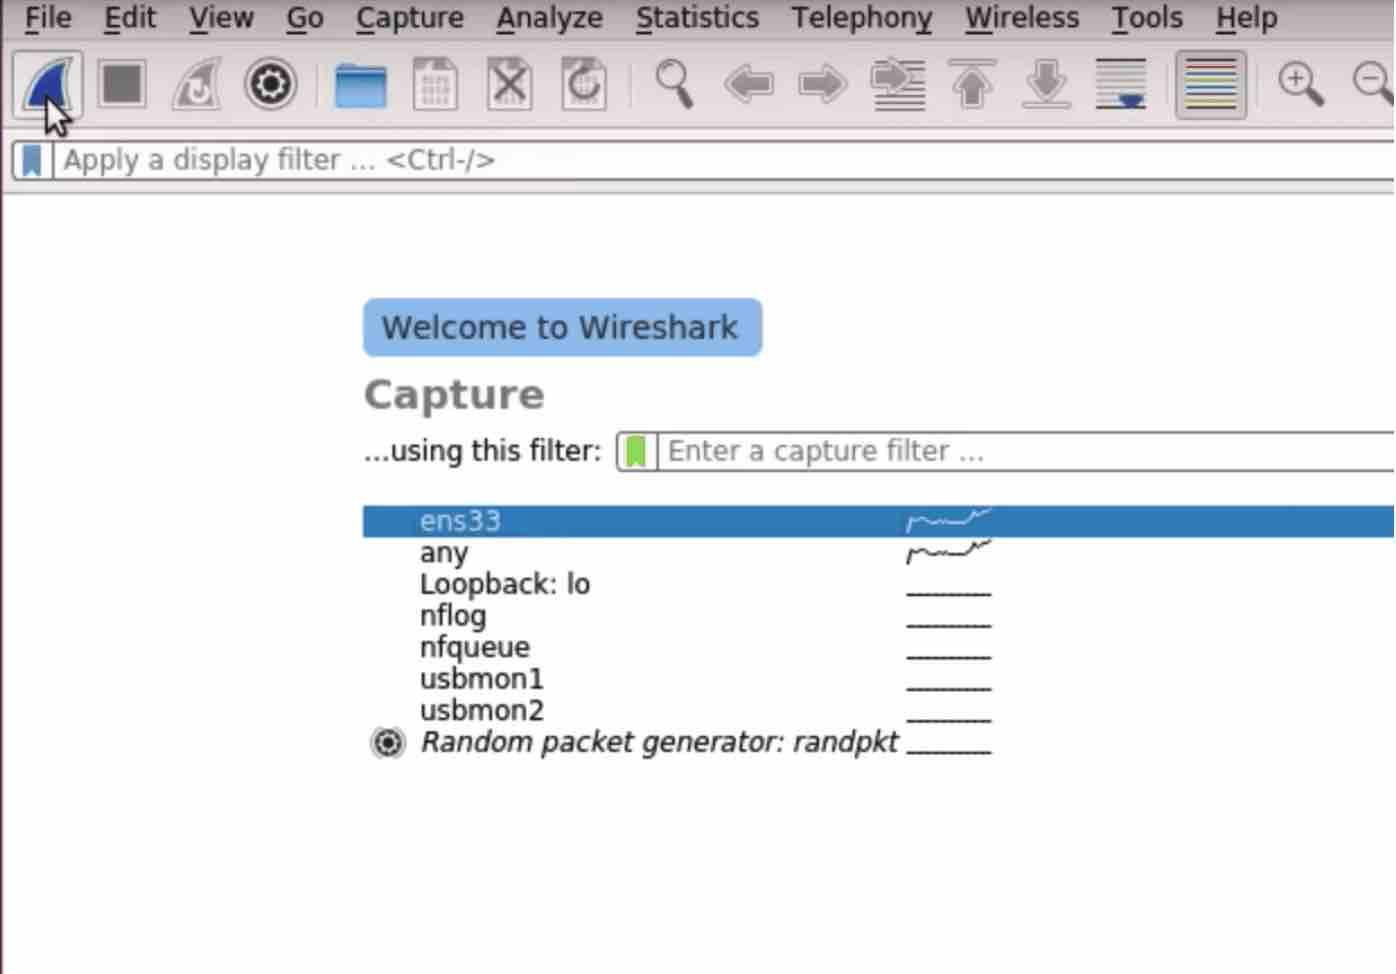
Wireshark interface displaying real-time captured network packets
32 – Icinga 2 – Open Source Monitoring Solution for Data Centers and Servers
Icinga 2, a prominent open-source monitoring tool, is meticulously engineered to provide comprehensive monitoring coverage for entire data center infrastructures. Its versatile design enables it to effectively monitor environments ranging from a single server to expansive, multi-server deployments, all managed from a unified monitoring system. Icinga 2 excels at proactively verifying the operational availability and health of critical resources, encompassing system updates, network infrastructure components, and a diverse array of essential services. In scenarios where significant issues arise, such as power disruptions or network infrastructure failures, Icinga 2 is adept at promptly alerting system administrators, facilitating timely intervention and issue resolution to maintain operational continuity.
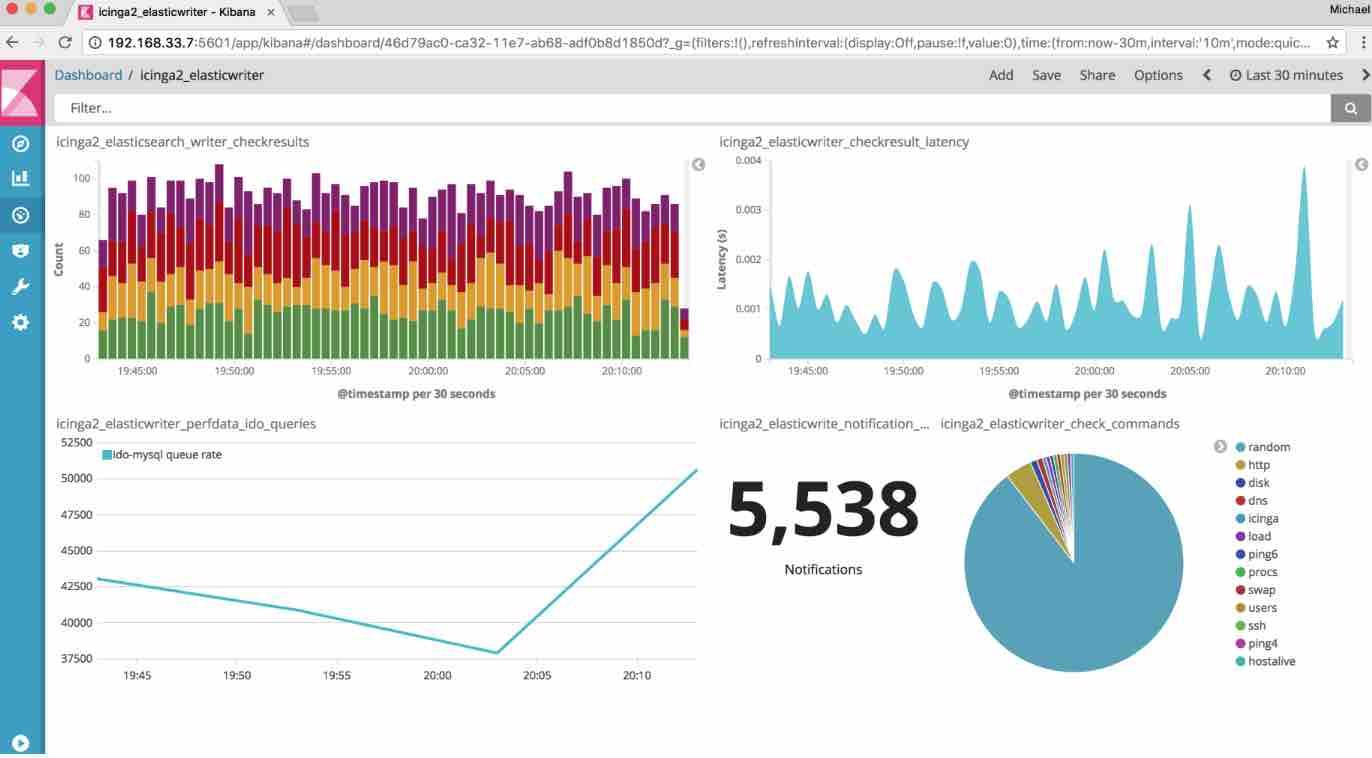
Icinga 2 web interface for comprehensive system and network monitoring
33 – Conky – Lightweight System Monitor for Linux Desktops
Conky is a highly regarded free and lightweight system monitoring application specifically tailored for Linux desktop environments. This versatile tool is renowned for its capability to present a wealth of detailed, real-time information directly on your desktop background, providing at-a-glance insights into critical system metrics. Conky can display comprehensive data pertaining to disk usage patterns, CPU load and utilization, RAM consumption levels, network interface statuses, active network connections, and currently running processes, among numerous other system parameters. Its unobtrusive and customizable nature makes Conky a favorite among Linux users seeking visually accessible and readily available system performance data.
Conky can be installed on Ubuntu systems (versions 14.04 and later) using a series of commands to add a repository and then install the application and its manager:
sudo add-apt-repository ppa:teejee2008/ppa
sudo apt-get update
sudo apt-get install conky-manager
Once installed and configured, Conky will display system information directly on your desktop, similar to the sample output shown below:
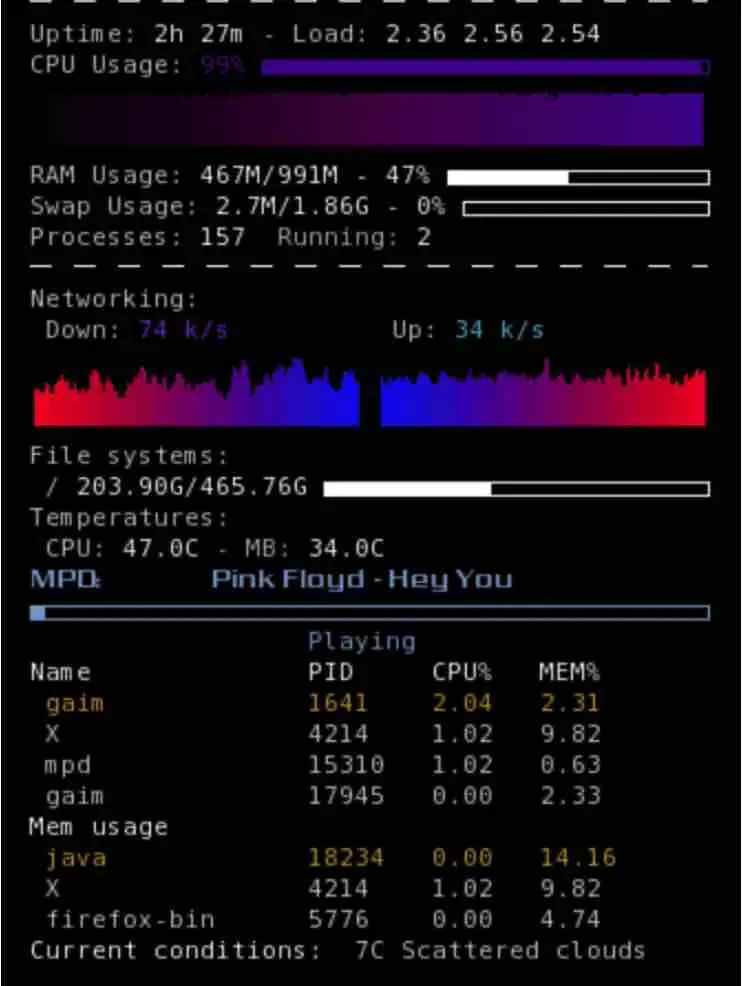
Conky desktop display showing system resource usage
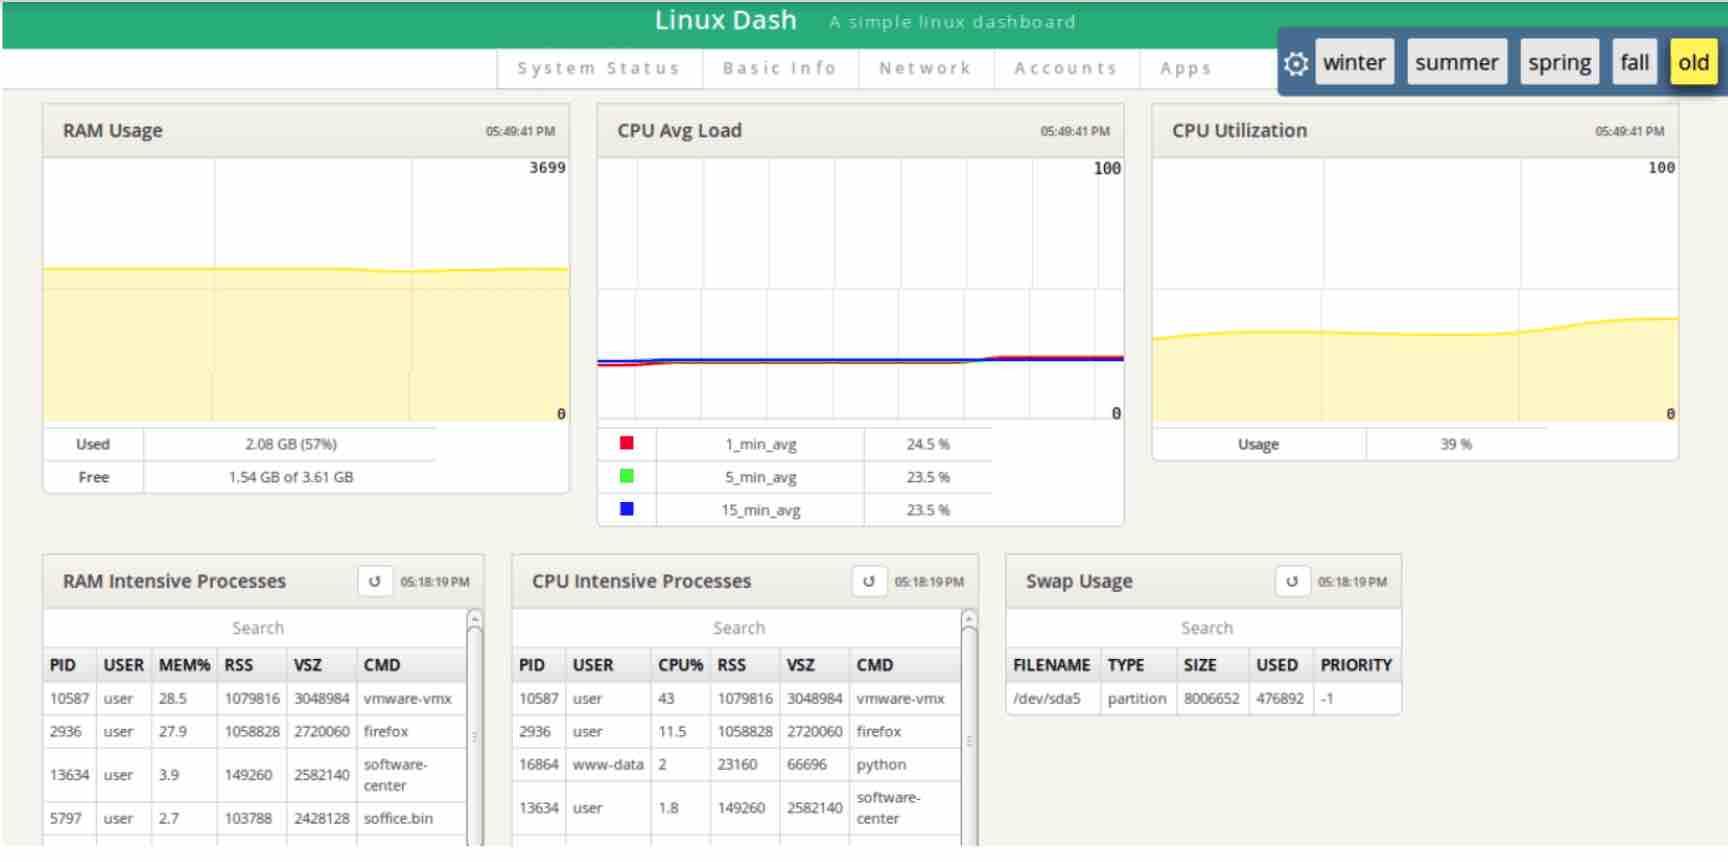
34 – Linux Dash – Lightweight Web-Based System Dashboard
Linux Dash, aptly named, is an open-source and exceptionally lightweight web-based dashboard meticulously crafted to present a comprehensive overview of your Linux system’s operational status and performance metrics. Accessible via any web browser, Linux Dash dynamically displays a wealth of detailed information, encompassing critical aspects such as CPU utilization, RAM usage statistics, currently running processes, file system status and capacity, active users, and real-time device bandwidth consumption. Its intuitive web interface ensures ease of access and interpretability of key system parameters.
As Linux Dash is implemented using PHP, the initial setup necessitates the installation of the PHP package on your Linux server. Furthermore, an Apache2 web server instance is required to host and serve the Linux Dash web interface. To fulfill these prerequisites, you can execute the following sequence of commands in your terminal:
# apt-get install apache2 apache2-utils
# apt-get install php5 curl php5-curl php5-json
# service apache2 start
Subsequently, you will need to download the Linux Dash package directly from its GitHub repository. This can be achieved using the git clone command as follows:
git clone https://github.com/afaqurk/linux-dash.git
Finally, ensure that your Apache web server is actively running to enable access to the Linux Dash web interface. Once these steps are completed, you can access the dashboard through your web browser.
Here is an illustrative example of the Linux Dash web interface, showcasing its presentation of system metrics:
Read: How to install Apache web server on Ubuntu
35 – Observium – Network Monitoring Utility for Server Network Management
Observium stands out as another noteworthy network monitoring utility meticulously crafted to facilitate the effective management of your server network infrastructure. Its versatile design ensures compatibility and seamless operation across a broad spectrum of operating systems, diverse platforms, and numerous device types commonly encountered within modern network environments. For individuals and organizations seeking more in-depth information pertaining to Observium’s features, capabilities, and deployment options, comprehensive details are readily accessible on the official Observium website: https://www.observium.org/.
36 – Netstat – Command-Line Utility for Network Packet Monitoring
Netstat (Network Statistics) is a versatile command-line utility that empowers users to meticulously monitor both incoming and outgoing network packets traversing a Linux system. It furnishes a wealth of invaluable information, encompassing details such as the local network address, the remote or foreign address involved in the connection, comprehensive data transmission statistics (data sent and received), and a plethora of other pertinent network parameters. The Netstat utility boasts an extensive repertoire of command options, enabling users to tailor its output and focus on specific aspects of network activity. Some of the most frequently employed Netstat commands include:
Netstat –a
This command option serves the purpose of displaying a comprehensive listing of all active TCP and UDP connection ports currently open on the system. Furthermore, users have the flexibility to refine the output by employing supplementary flags: –at, which specifically isolates and presents TCP port connections exclusively, and –au, which, conversely, restricts the display to UDP port connections solely.
Netstat -l
This command option is specifically employed to enumerate and display all network connections that are currently in a “listening” state on the machine. Listening connections signify processes that are actively awaiting incoming network connection requests on designated ports.
Netstat –st
To obtain a focused view of network activity pertaining exclusively to the TCP (Transmission Control Protocol) protocol, this command option is utilized. It effectively filters the Netstat output to showcase only TCP-related protocols and connections.
Netstat –su
Conversely, to specifically examine network activity associated with the UDP (User Datagram Protocol) protocol, this command option is employed. It tailors the Netstat output to present only UDP-specific protocols and connections, enabling targeted analysis of UDP-based network communications.
37 – Lm-sensors – Hardware Health Monitoring for Ubuntu Systems
Lm-sensors (Linux-monitoring sensors) is a highly effective utility meticulously designed for comprehensive temperature monitoring within Ubuntu and other Linux-based systems. Its primary utility lies in its ability to accurately gauge CPU temperatures and facilitate broader hardware health monitoring, providing users with valuable insights into the thermal performance and overall well-being of their system components. To proceed with the installation and subsequent execution of Lm-sensors, users can employ the following sequence of commands:
sudo apt-get install lm-sensors
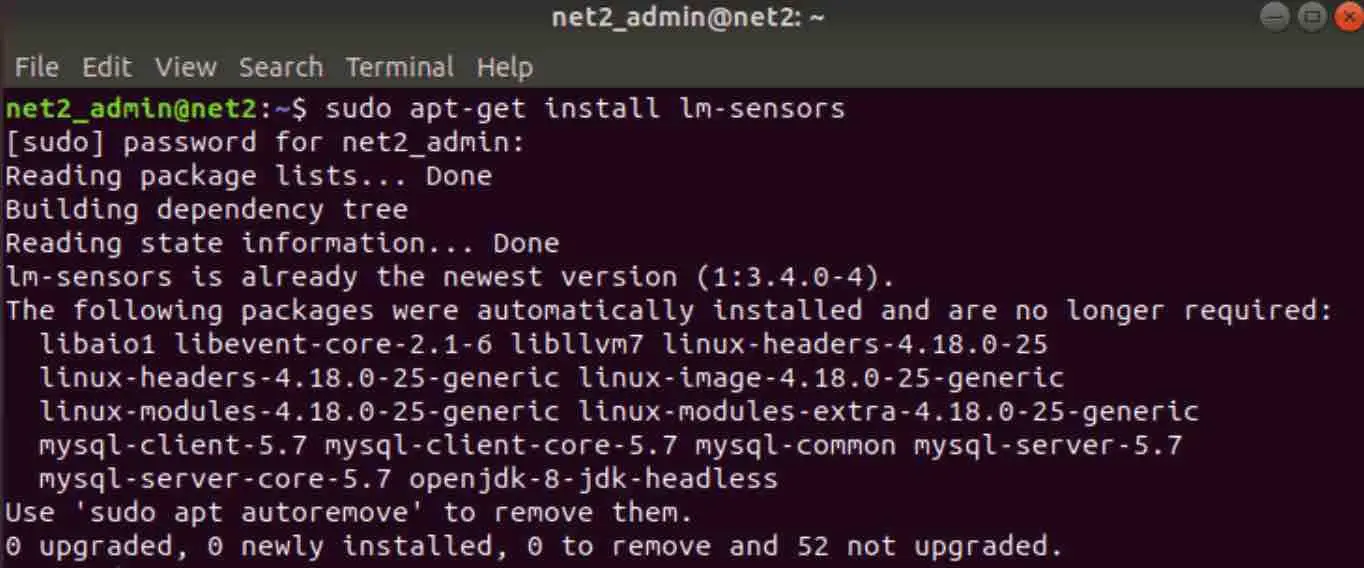
Command to install lm-sensors package
Upon successful installation of the Lm-sensors utility, users can readily retrieve and display real-time CPU temperature readings by issuing the subsequent command within their terminal environment:
sensors
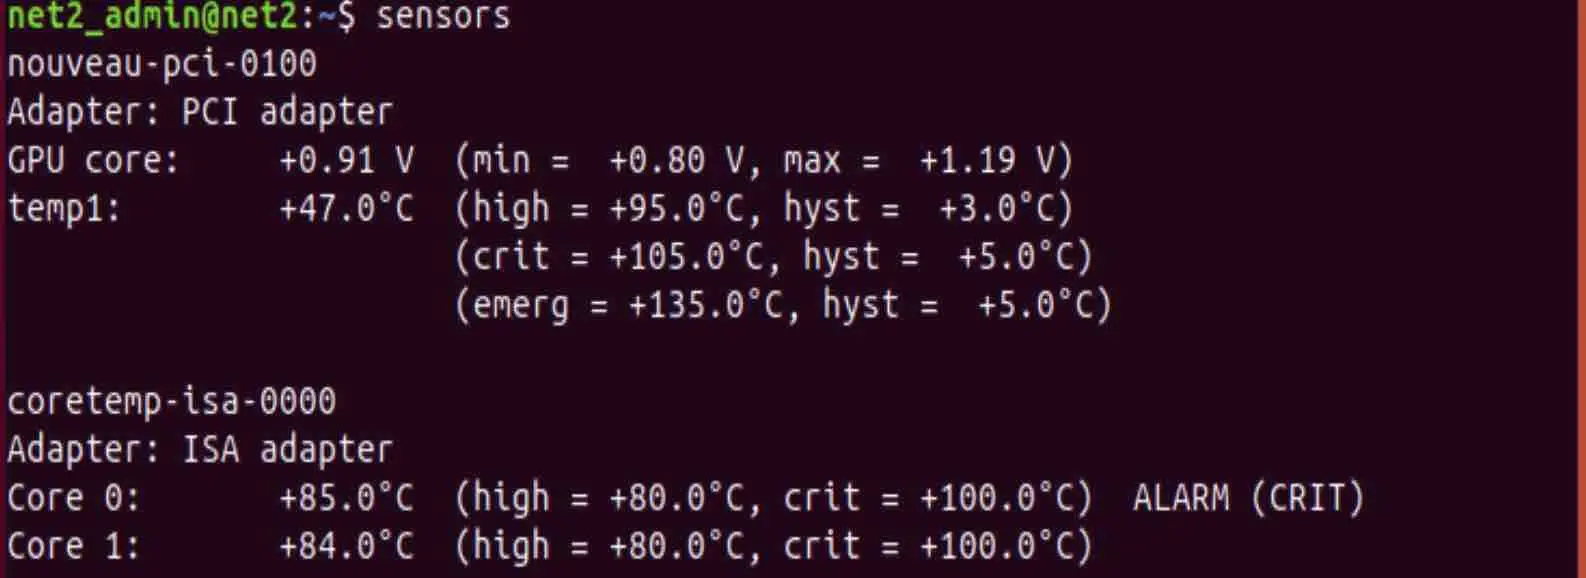
Lm-sensors command output showing CPU temperature readings
38 – Hddtemp – Monitoring Hard Disk Drive Temperatures in Linux
Hddtemp (HDD temperature) is a specialized utility exclusively dedicated to the task of monitoring the operating temperature of hard disk drives (HDDs) within a Linux system. To acquire and install the hddtemp utility, users can simply input the ensuing command into their terminal prompt:
sudo apt-get install hddtemp
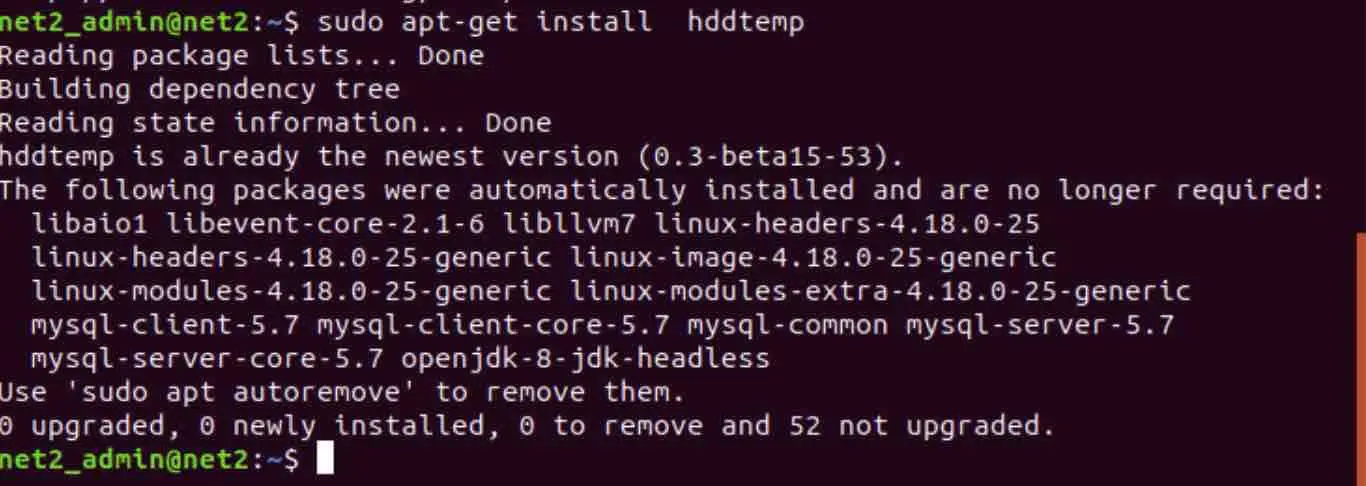
Command to install hddtemp for HDD temperature monitoring
Once the installation process is successfully concluded, users can proceed to query and retrieve the temperature reading for a specific hard drive by employing the following command structure. It is imperative to substitute your_hard_drive_name with the precise device name or identifier corresponding to the hard drive for which temperature information is sought:
hddtemp your_hard_drive_name
39 – GNOME System Monitor – A Graphical System Monitoring Tool for Linux
The GNOME System Monitor is a user-friendly, graphical interface (GUI) tool for monitoring system resources on Ubuntu and other Linux distributions that utilize the GNOME desktop environment. For users familiar with Windows, it serves a similar function to the Task Manager, providing a real-time overview of all active processes. With GNOME System Monitor, you can not only observe running processes but also manage them by stopping or resuming as needed. If the GNOME System Monitor is not already installed on your system, you can easily install it via the terminal using the following command:
sudo apt-get install gnome-system-monitor
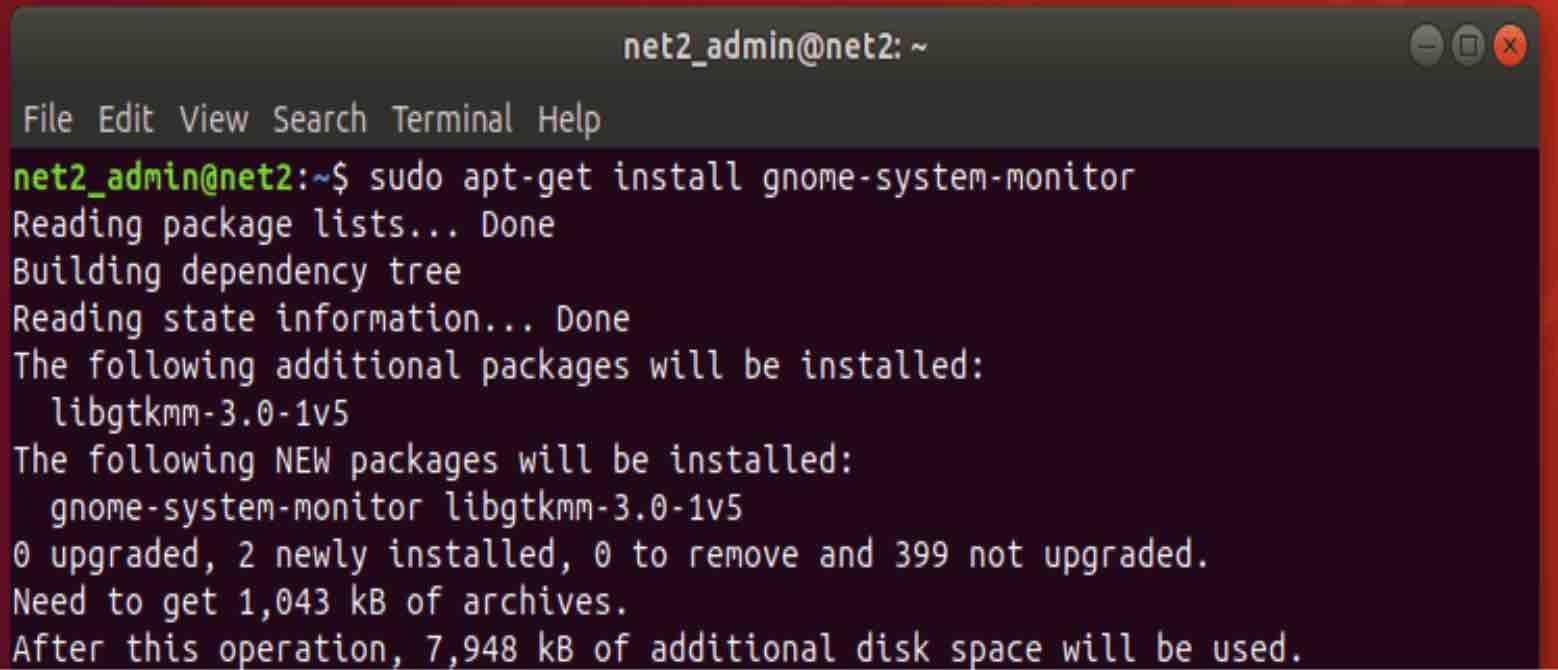
Installing GNOME System Monitor via command line
Once the installation process is complete, you can launch the GNOME System Monitor by entering the command below into your terminal:
gnome-system-monitor
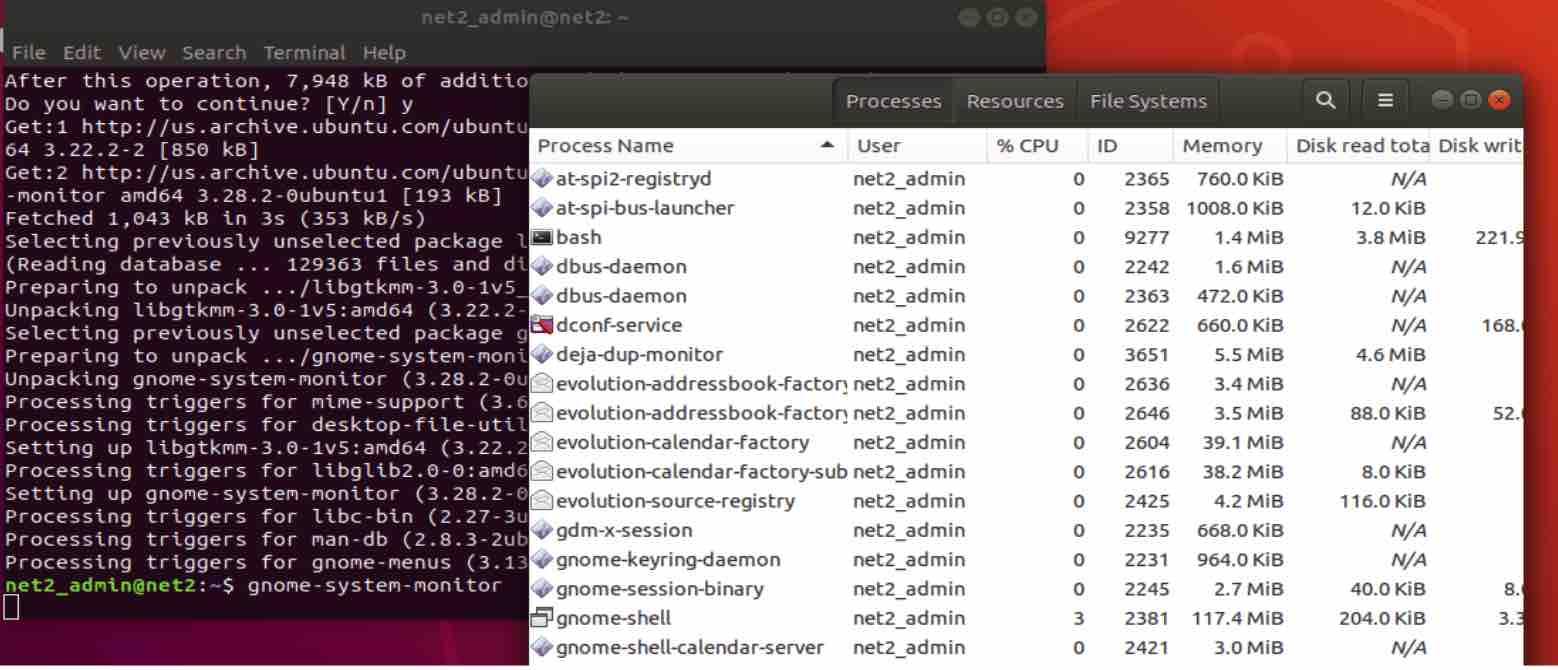
Launching GNOME System Monitor from terminal
Alternatively, if you prefer not to use the command line, you can also install the GNOME system monitor through a graphical interface. Simply follow these steps:
- Open the “Software” application, which can be found in your activities toolbar.
- In the Software app’s search bar, type “gnome system-monitor” and initiate the search.
- Locate “gnome system monitor” in the search results and click on it to proceed with the installation.
- After the installation is finished, click the “Launch” button to start the GNOME System Monitor application.
40 – Nagios – Open Source System and Network Monitoring for Linux
Nagios is a powerful and widely-used open-source system and network monitoring solution for Linux environments. It provides comprehensive monitoring of various aspects of your system, including currently running processes, CPU load, memory utilization, and network services such as SMTP (Simple Mail Transfer Protocol) and POP3 (Post Office Protocol), among many others. While Nagios offers a command-line interface (CLI) for monitoring, its strength lies in its script support, which enables remote monitoring capabilities suitable for enterprise-level deployments. This allows administrators to monitor a large number of systems from a central Nagios server.
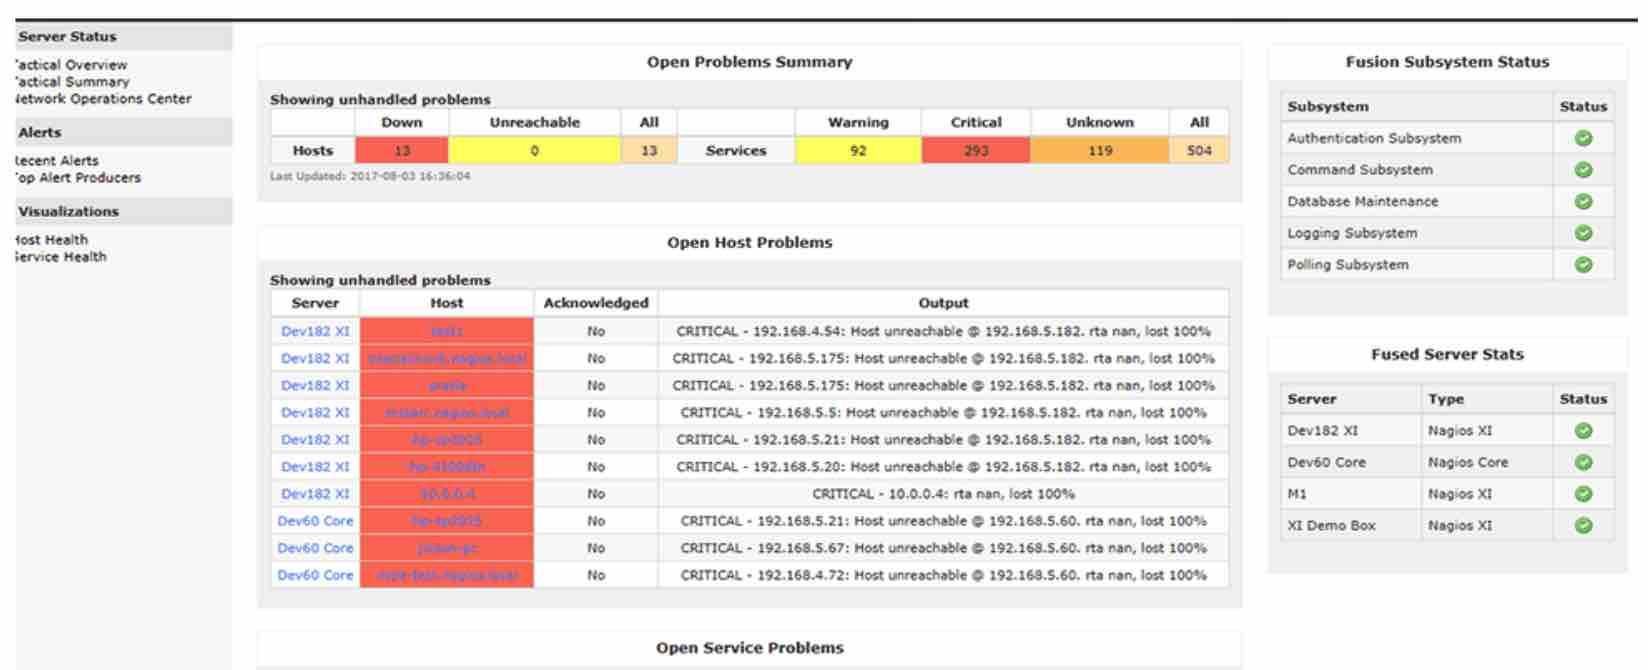
Nagios web interface for system and network monitoring
41 – Psensor – GUI-Based Hardware Temperature Monitoring for Linux Desktops
Psensor is a user-friendly, GUI-based temperature monitoring tool considered excellent for Linux systems. It’s capable of monitoring temperatures from various hardware sensors, including the motherboard, CPU cores, Nvidia GPUs, hard disks, and more. To utilize Psensor effectively, you first need to have lm-sensors installed, as mentioned previously. Once lm-sensors is set up, you can install Psensor by entering the following command in your terminal:
sudo apt install psensor
After the installation is complete, you can launch Psensor by simply typing the command psensor in your terminal. This will open the Psensor graphical interface, displaying real-time temperature readings from your hardware sensors.
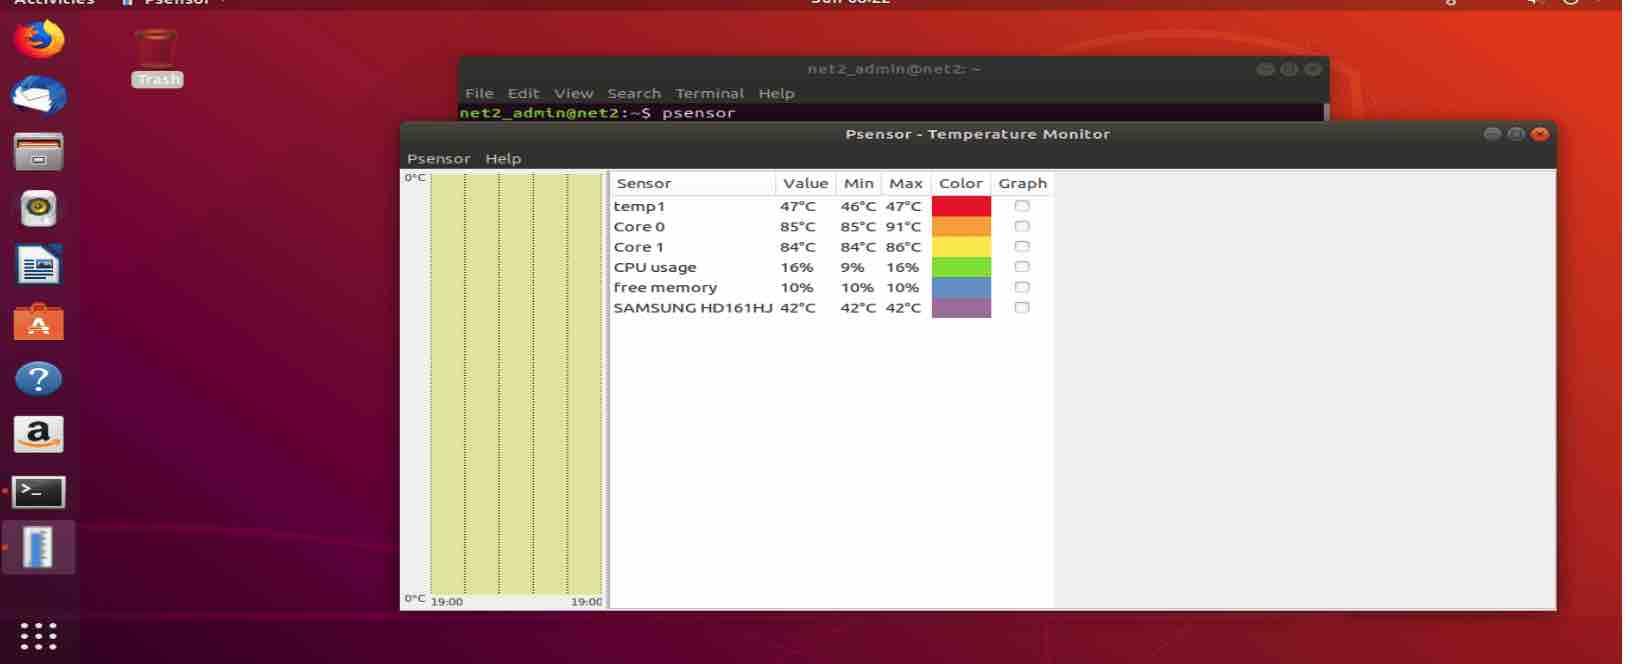
Psensor GUI displaying hardware temperature readings
Frequently Asked Questions:
What are the most effective Linux performance monitoring commands for a real-time snapshot of system resource utilization?
For a system administrator seeking a quick, command-line overview of Linux system resource usage in real-time, TOP remains a highly recommended starting point. This utility, pre-installed on nearly all Linux distributions, provides a dynamic, continuously updating view of CPU utilization, memory consumption (RAM and swap), and a list of running processes. It’s excellent for identifying which processes are currently most active and consuming the most resources.
For those desiring an enhanced user experience, HTOP builds upon TOP, offering a more interactive interface with improved process management, and can be easily installed using sudo apt-get install htop on Debian/Ubuntu-based systems or equivalent commands on other distributions. Both tools are invaluable for initial performance diagnostics and quick system health checks.
Are Linux monitoring tools primarily command-line based, or are there robust graphical user interface (GUI) options available for easier visualization and analysis?
While Linux is renowned for its powerful command-line tools, a rich ecosystem of GUI-based performance monitoring applications exists to cater to administrators who prefer visual interfaces. For command-line aficionados, tools like TOP, HTOP, VMSTAT, IOSTAT, and SS offer unparalleled depth and control.
However, for visually-driven monitoring, options such as GNOME System Monitor (a task manager equivalent), MUNIN (for network and system graphing), CACTI (for advanced network performance graphs), IFTOP (with its text-based but visually-oriented network bandwidth display), Wireshark (for detailed packet analysis with a GUI), Psensor (for graphical hardware temperature monitoring), and Linux Dash (a web-based system dashboard) provide intuitive dashboards, charts, and graphs.
The choice between CLI and GUI tools often depends on the specific monitoring task, user preference, and the depth of analysis required. For quick checks and remote server management, CLI tools are often preferred for their efficiency and low overhead. For in-depth analysis and historical trend visualization, GUI tools can offer a more user-friendly and insightful experience.
For diagnosing network performance bottlenecks, which Linux network monitoring tool is best suited to analyze bandwidth usage per process in real-time?
When troubleshooting network performance issues and identifying bandwidth-hungry processes in real-time, Nethogs is an exceptional command-line tool. Unlike general network monitoring tools that show aggregate traffic, Nethogs provides a process-centric view, displaying bandwidth usage broken down by individual processes and applications.
This granularity is crucial for pinpointing the exact processes responsible for network congestion or unexpected bandwidth spikes. To install Nethogs, use sudo apt-get install nethogs (or equivalent for your distribution), and then run it with administrative privileges using sudo nethogs to begin real-time, process-level network monitoring.
Its output dynamically updates in the terminal, making it easy to spot bandwidth culprits immediately.
How can system administrators effectively monitor disk input/output (I/O) performance on Linux servers to identify and resolve disk bottlenecks impacting application performance?
To effectively monitor disk I/O performance and diagnose storage-related bottlenecks on Linux servers, Iotop is an indispensable open-source command-line utility. Iotop operates similarly to TOP but focuses specifically on disk I/O activity. It displays a real-time list of processes and threads, ordered by their disk I/O usage, showing read and write bandwidth, and swap usage.
This process-level detail is invaluable for identifying applications or processes that are excessively reading from or writing to disk, which can lead to performance degradation. To install Iotop, use sudo apt-get install iotop, and then execute it with sudo iotop to start monitoring.
The output will show you which processes are contributing most significantly to disk I/O load, enabling targeted troubleshooting and optimization efforts to alleviate disk bottlenecks and improve overall system responsiveness.
What are the recommended Linux tools for monitoring hardware health metrics, specifically CPU temperature, and how can these tools aid in preventing hardware-related performance issues or failures?
For monitoring hardware health, particularly CPU temperature and other sensor data on Ubuntu and similar Linux distributions, Lm-sensors is a highly recommended command-line utility. It interfaces with hardware monitoring chips to read temperature, voltage, fan speed, and other sensor readings from your system’s components. To install Lm-sensors, use the command sudo apt-get install lm-sensors.
After installation, running sensors in the terminal will display a detailed readout of temperature and sensor values. For a graphical interface to visualize these temperature readings, Psensor is an excellent choice. Installable via sudo apt install psensor, Psensor provides a GUI to monitor CPU, GPU, hard drive, and motherboard temperatures, allowing for easy visual tracking of hardware thermals. Monitoring CPU temperature and other hardware health metrics is crucial for preventing overheating and potential hardware damage, ensuring system stability and longevity.
By proactively monitoring these metrics, administrators can identify cooling issues, optimize system airflow, and prevent performance throttling or hardware failures due to thermal stress. Regular hardware health monitoring is a best practice for maintaining reliable Linux server and desktop environments.
If you like the content, we would appreciate your support by buying us a coffee. Thank you so much for your visit and support.