On Linux operating system, the messages that are triggered by the kernel, by the system services and by the running applications are written and stored on log files. Different types of information are stored on different log files, for instance, security messages are stored on a specific log files, cron tasks log their messages on another log file and so forth.
Since error messages are stored on log files, system administrators are able to identify, diagnose and troubleshoot Linux issues, such as unauthorized log-ins, memory overflows and boot issues by analyzing the systemd collected log files…
In this article you will learn how to use systemd tools (linux logging commands), mainly journalctl, to find and view log entries as well as how to exploit their invaluable information in order to easily and quickly solve system problems.
1 – Introduction to systemd
When a Linux based system boots up, the systemd utility provides a mechanism that controls what programs run. It also starts a system activity journal, a cron job scheduler, the network stack, user logins and several other jobs as well.
Process and system logging are the most interesting advantages of systemd since some other tools (except syslog, syslog-ng, rsyslog) do not offer a central logging mechanism which makes logs dispersed all over the system and managed by different daemons making it difficult for analysis and interpretation.
To address these issues, systemd provides a centralized management approach for logging user, kernel and processes much like the handling of service management and boot process. The collection and the management of these logs is carried out by the journal which is implemented with a daemon named journald.
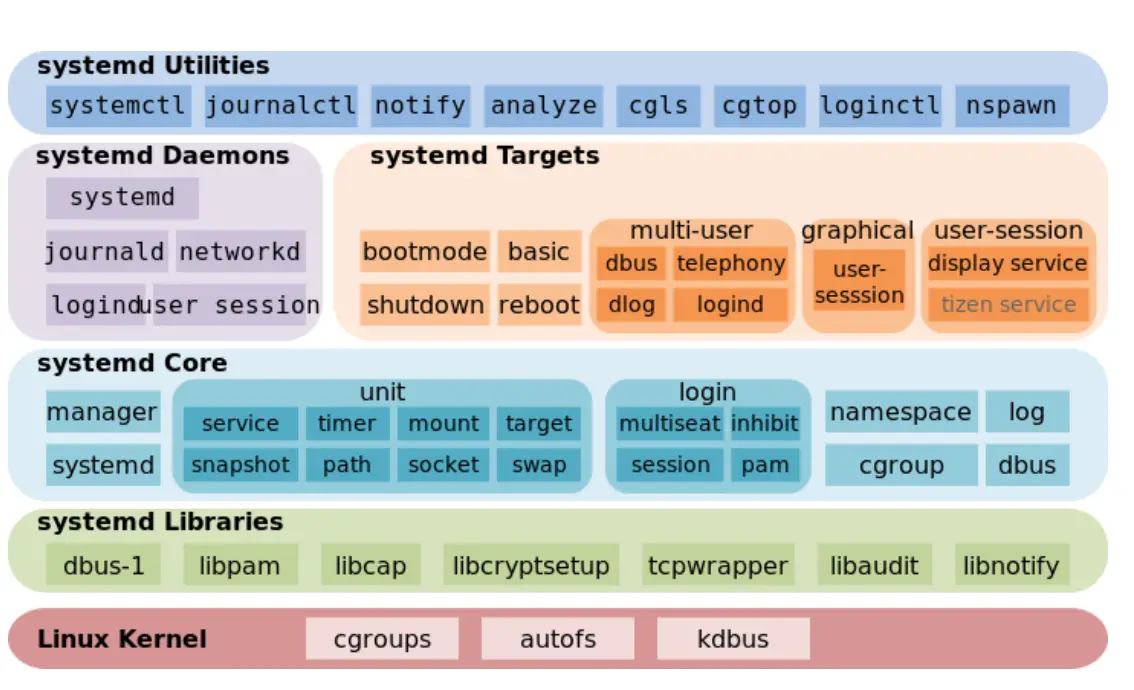
Courtesy : ZDNet
By having a single tool to interact with, users and systems administrators have the ability to view log data for quick analysis and diagnostics of the system.
Binary formatted log data storage enables the log records to be shown in any required output format. Systems administrators may be used to display the logs in the syslog standard format when they carry out their daily log management tasks. If for instance they decide to display service interruption or kernel drivers loading events on a graph, they will be able to do so by outputting each log entry as a JSON object in order to feed it to the graphics software of their choice when applicable.
Read: How to set up a firewall on Ubuntu 22.04
2 – journald daemon
A component of systemd, the journald daemon performs also the management of log files.
It can capture Syslog messages, boot and initial RAM disk messages, kernel log messages and also messages written to standard output and to all services standard error output. journald daemon indexes these messages and makes them available to the system administrator for dynamic and easy manipulation.
The journal file which is a native format, is an indexed and structured binary file that provides faster operation and improved search ability. It also stores Metadata information like user IDs or timestamps.
The systemd journal can be used as an alternative to the syslog functionality or it can be put to use with an existing syslog routine implementation depending on your requirements.
Most administrators’ or root users’ logging needs can be met by using the systemd journal which can coexist as well with other logging tools users might be familiar with.
Read: How to fix high memory usage in Linux
3 – Log records timestamp
It is possible to view log records in local or at any chosen time when relying on a binary journal for the purpose of logging system wide events and messages. In order to help you set up your preferred time correctly before we tackle the journal, you can use a utility called timedatectl which is part of the systemd suite.
To see the available timezones, run the command below :
timedatectl list-timezones
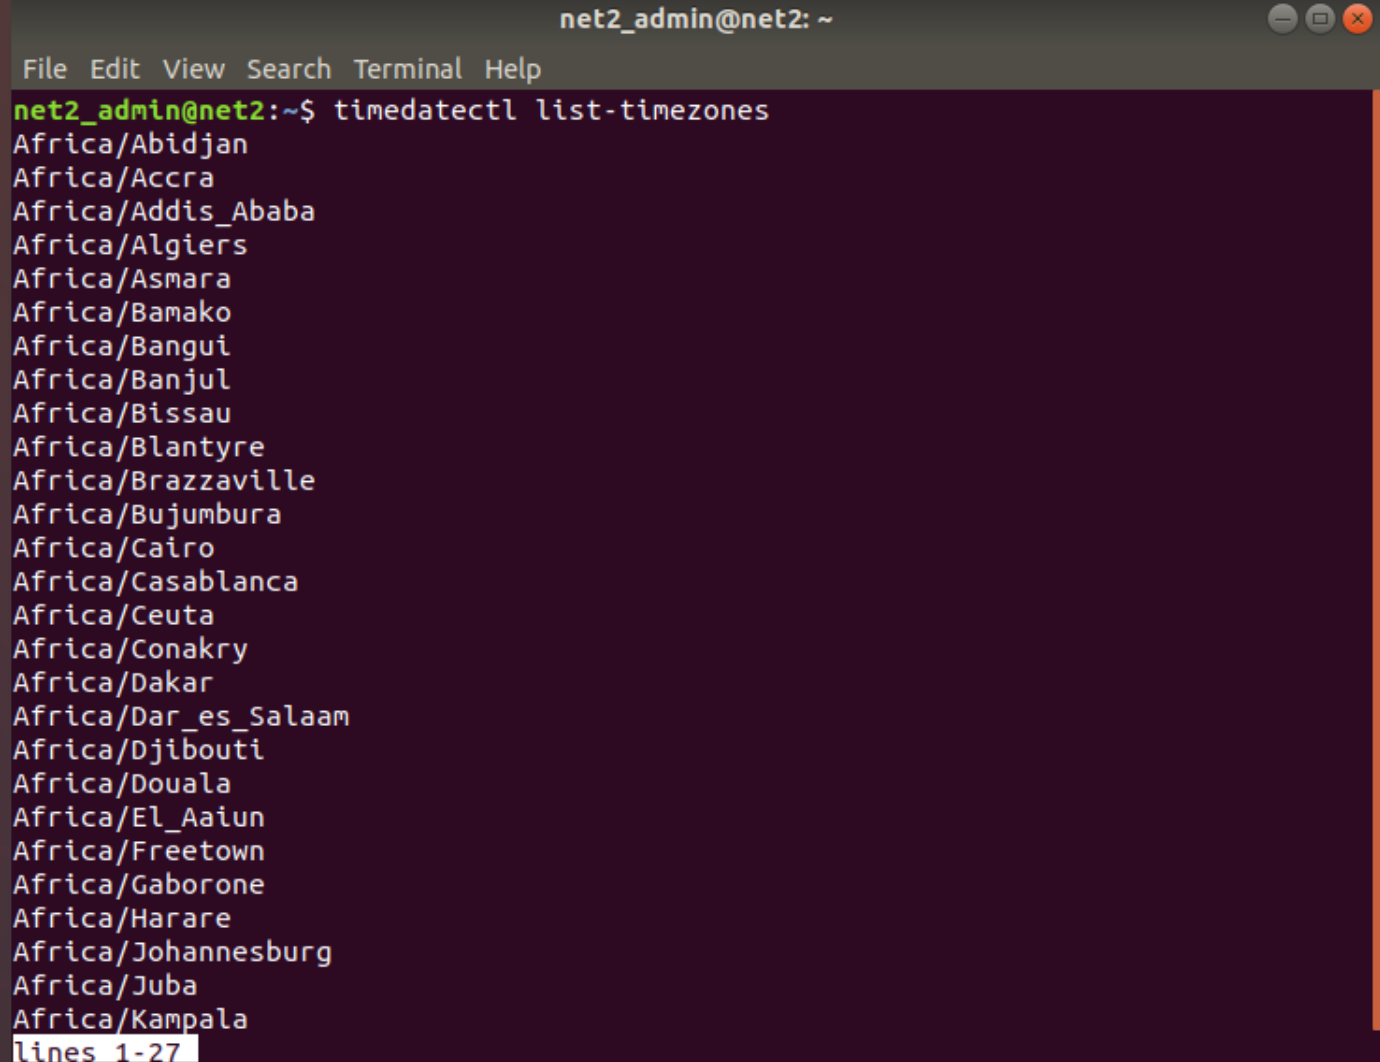
Press “q” to quit.
The list of timezones that are available on your system will be displayed. Now you are able to set your own timezone by using the option set-timezone as shown below:
sudo timedatectl set-timezone zone

In order to check that this was taken into account by the system, invoke the command below :
timedatectl status

Which shows indeed that the timezone matches the one that was entered above. From now on, all of the logs will be displayed in this format. If however you would like to view the timestamps in UTC, just run the command as shown below :
journalctl –utc
4 -Viewing Logs
Using the journalctl command will show the logs the journald daemon has gathered.
Each journal record or entry will be shown within a pager and the oldest ones will be displayed at the top :
journalctl
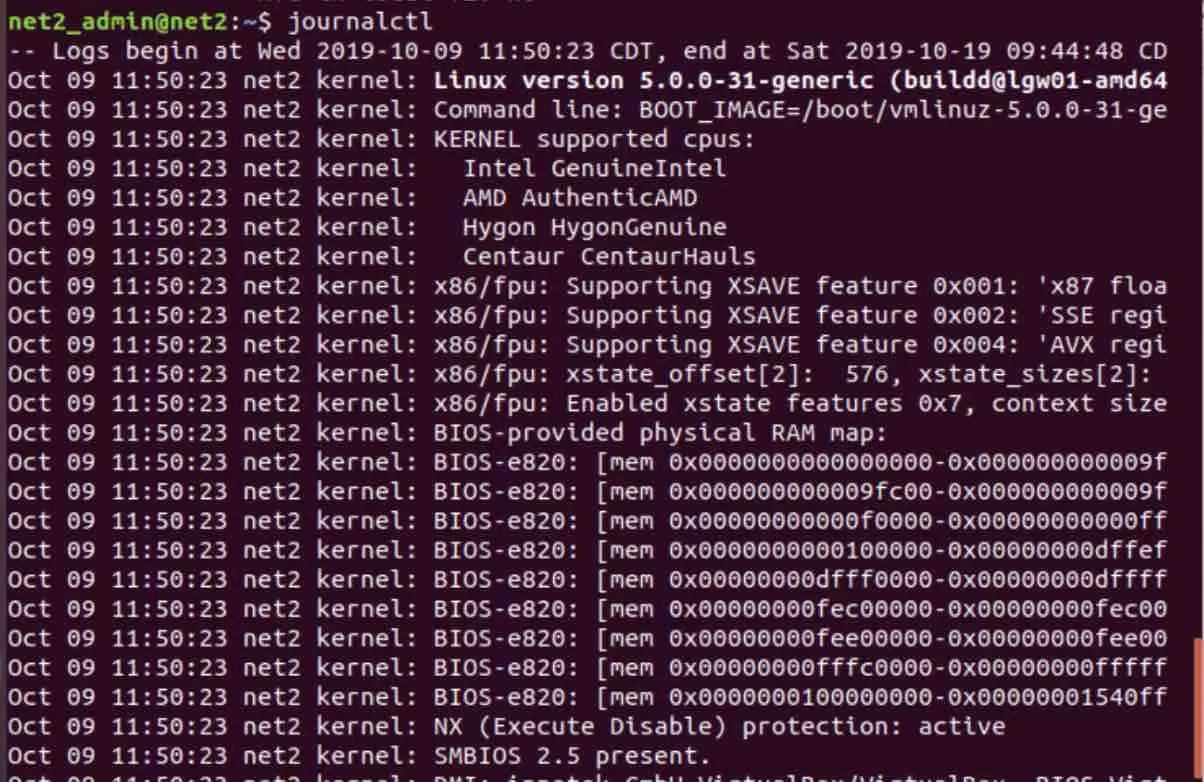
If systemd has been on your system for long, you will likely obtain hundreds if not thousands of pages of logs which shows how big the journal database can become.
For those who are used to viewing syslog display, they will find the format above pretty familiar. System administrators should note that the data displayed by journalctl above has been collected from more sources when compared to those that standard syslog routine implementations can gather from. This includes Linux error logs from the kernel, the initrd, standard application error output and early boot process logs.
Read: How to keep Ubuntu clean
5 – Journal filtering options
For this section, you may want to refer to our article about how to analyze Linux systemd logs using journalctl advanced filtering options ?.
6 – Journal output format
It is possible to modify the way journalctl outputs its log data. For instance users can truncate or expand the display. They can also redirect the output to a file as well.
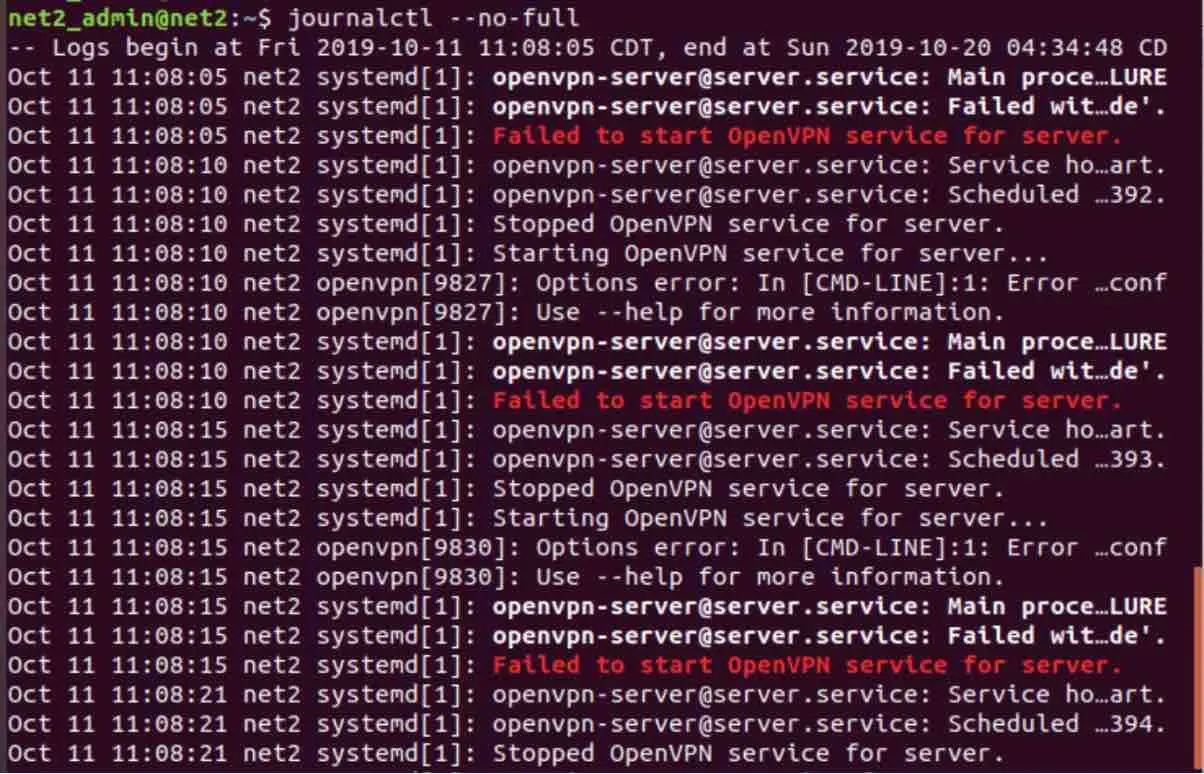
If you’d like to truncate the output, you can use the option –no-full:
journalctl –no-full
This will result in a display which looks like the one shown in the snapshot below :
7 – Output to file or to standard output
If you want to export the data to standard output for later processing with text editing tools for instance, you would need to use the –no-pager option :
journalctl –no-pager
Use a pipe immediately in order to redirect the data into a file or output it into a processing utility.
JSON format
In order to output the journal log entries in JSON, type in the command as in the example below:
journalctl -b -u ssh -o json
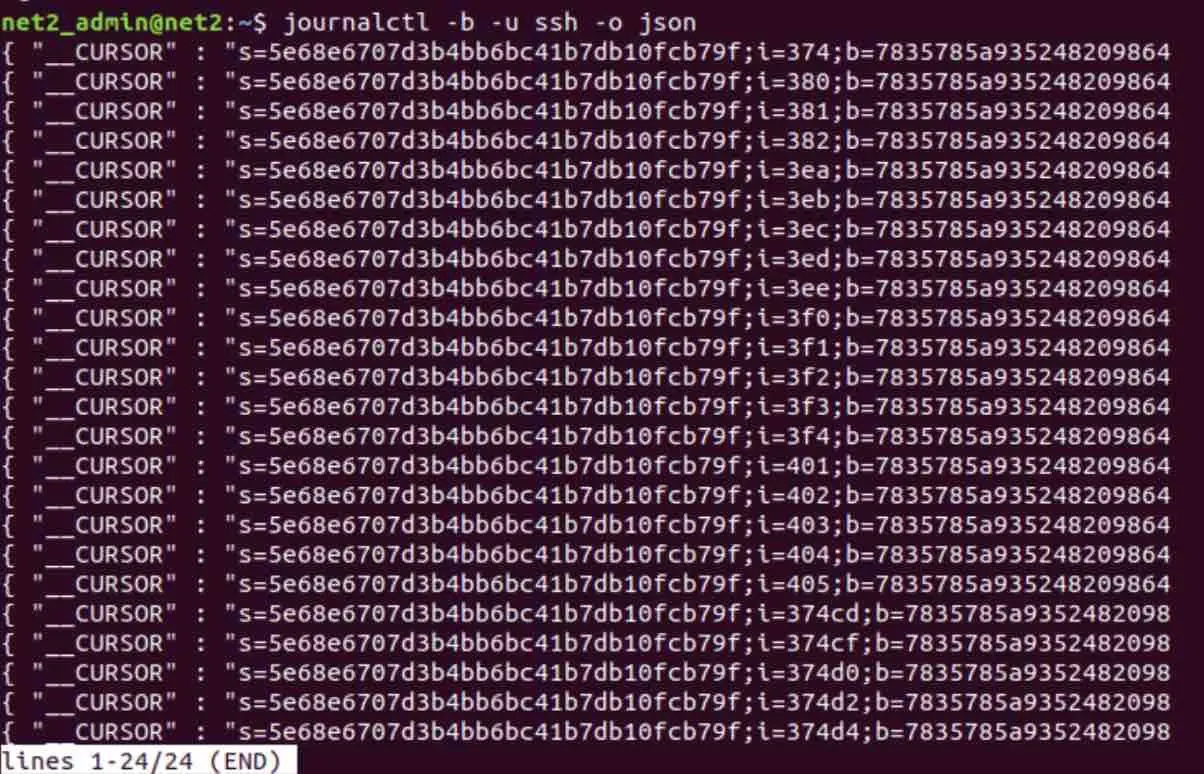
For even a nicer json output, use the json-pretty format as follows:
journalctl -b -u ssh -o json-pretty
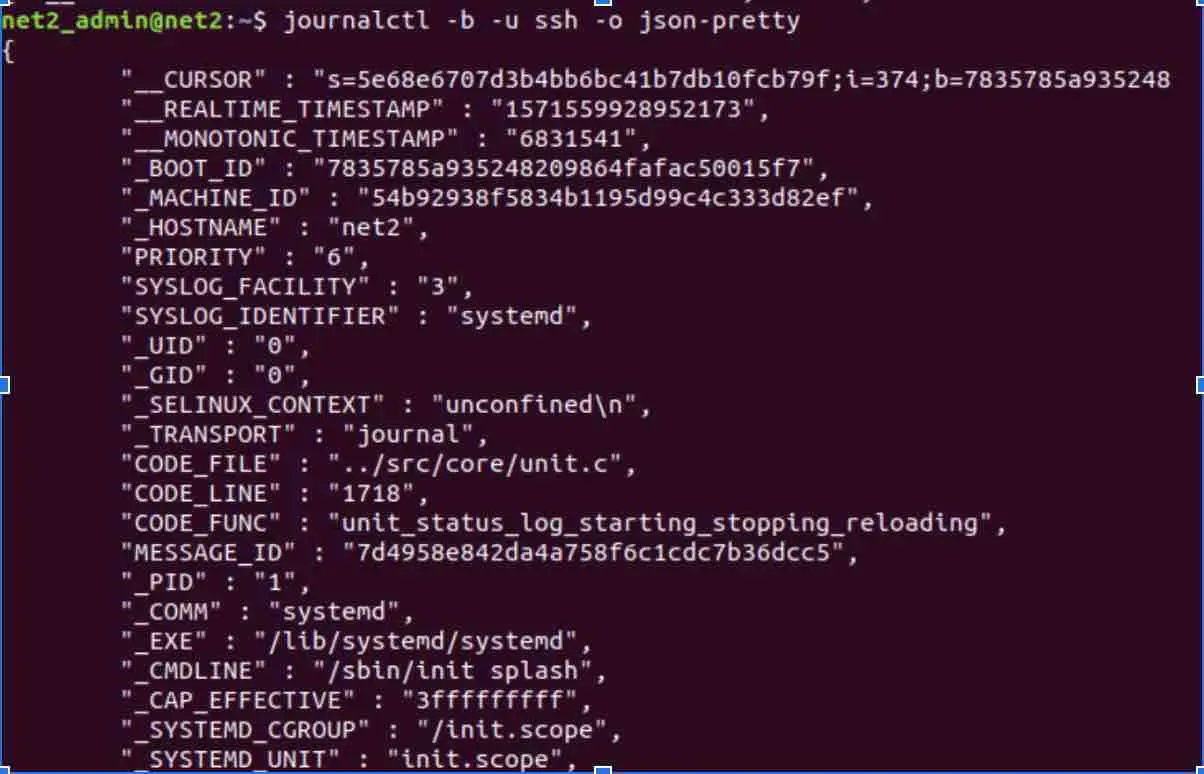
For more formats , you can visit this page.
Read: Ubuntu/Debian monitoring tools guide for system administrators
8 – Journal clean-up
Storing all the journal data will eat up a lot of space on the disk.
To know how much space is being used up by the journal use the –disk-usage flag:
journalctl –disk-usage

The command above shows that the journal is occupying more than 800M on disk.
The option –vacuum-size option allows you to remove older entries until the size reaches the requested amount :
sudo journalctl –vacuum-size=100M
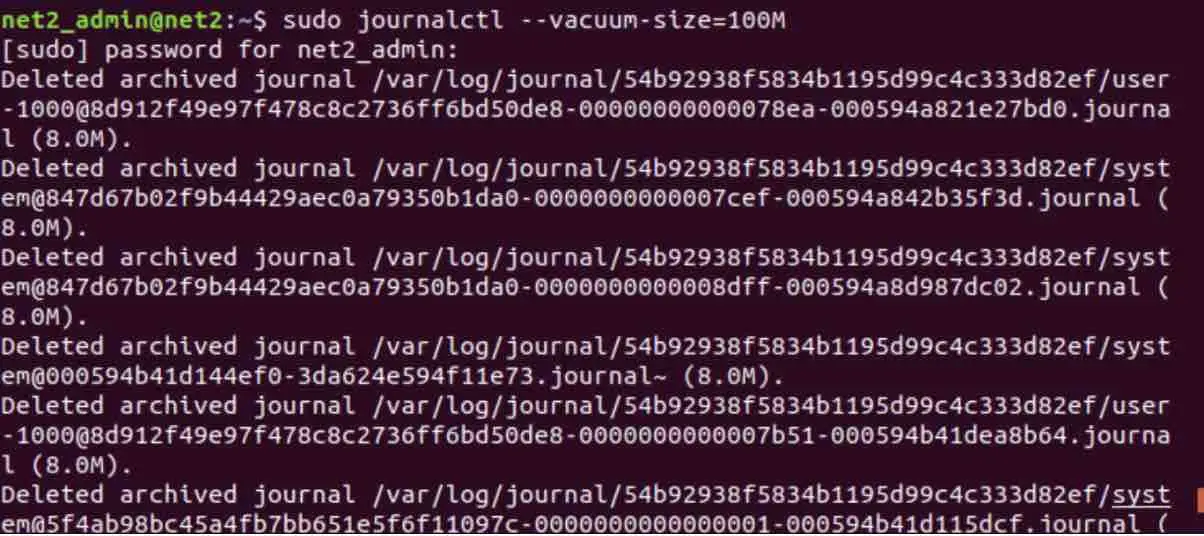
Now we can query the total size of the journal :

As expected the journal is now taking up about 100MB on disk.
Another method would be to use –vacuum-time option which allows to keep the records that were created after the indicated time. For example, to retain entries from the last year, type in the command:
sudo journalctl –vacuum-time=1years
9 – Limiting journal growth
It is possible to configure the journal so that you can control the amount of space the journal can occupy. This is achievable by editing the file /etc/systemd/journald.conf.
The following attributes are used to set limits on the journal growth in persistent storage:
- SystemMaxUse=: indicates the maximum amount of space the journal can occupy.
- SystemKeepFree=: indicates the amount of disk space the journal should keep free when journal entries are added to persistent storage.
- SystemMaxFileSize=: Specifies the amount of space large individual journal files can grow to – before being rotated.
- RuntimeMaxUse=: Indicates the maximum amount of disk space that can be put to use in volatile storage.
- RuntimeKeepFree=: When data is written to volatile storage, this indicates the space to be set aside for other uses .
- RuntimeMaxFileSize=: Indicates the space a single journal file can occupy in volatile storage – before being rotated.
These values will control the way journald preserves and consumes space. Note that RuntimeMaxFileSize and SystemMaxFileSize will target the files that are archived in order to reach indicated limits.
Conclusion
The systemd journal is a very useful utility for managing and collecting your application and system data. The centralized nature of the log and the automatically collected extensive metadata make systemd journal a very flexible tool that can be trusted and relied upon by system administrators . Journalctl is a systemd utility used for displaying and querying logs from systemd’s logging service, i.e. journald. It offers many options that help users to easily examine large amounts of log entries in order to quickly analyze system problems.
If you like the content, we would appreciate your support by buying us a coffee. Thank you so much for your visit and support.

