Updated on 05/1/2023 – As a system administrator, it is essential to regularly monitor the performance of your operating system, such as Ubuntu. With so many performance monitoring tools available for Linux, it can be challenging to select a reliable one.
In this article, we will explore some of the most popular linux performance monitoring tools, as well as tools for monitoring Linux networks and servers.
There are many tools available for monitoring system performance in Ubuntu, but “top” and “htop” are among the most widely used. Both of these tools allow users to monitor their system performance from the command line. “Top” comes pre-installed on Ubuntu, and can be launched by opening a terminal window and entering the command “top”. “Htop” is a similar tool that provides a more user-friendly interface and additional features. Both of these tools are useful for tracking the performance of your system and identifying potential issues.
Table of Contents
TOP
‘top’ , one of the most used Linux performance commands, simply shows the resources used by each app. For example, it shows CPU usage, memory usage, app name, and many more. Detailed features of “top” are shown in the picture below.
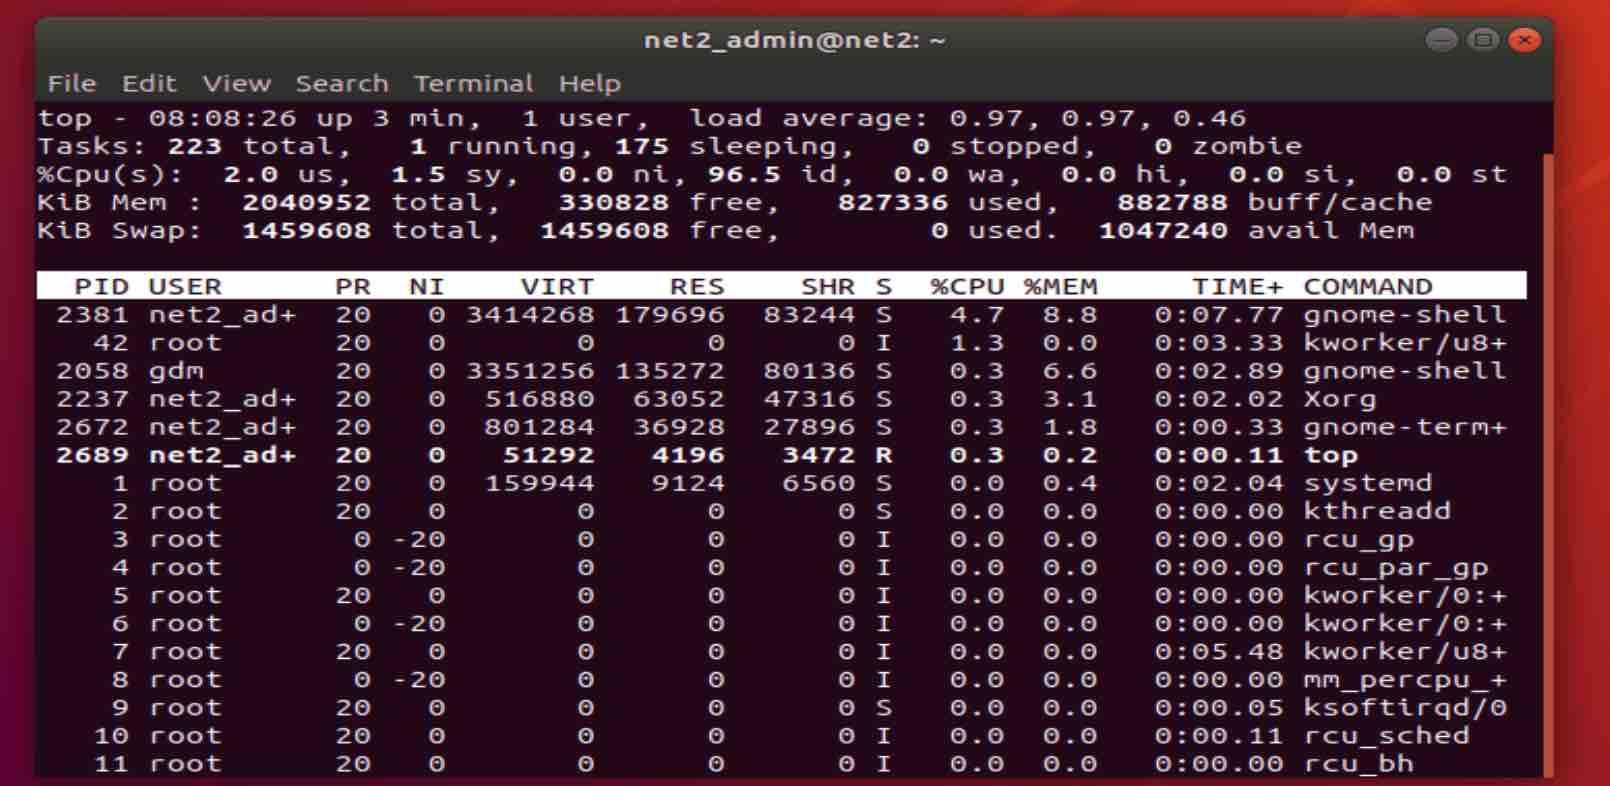
Ubuntu system monitor : top
HTOP
htop is a top based monitoring tool with some additional features. htop makes it easier and faster to kill high-resource-usage tasks. To use htop, simply open a command-line terminal and type in htop. Keep in mind that htop doesn’t come pre-installed like top. To install htop open the terminal and enter the following command:
sudo apt-get install htop
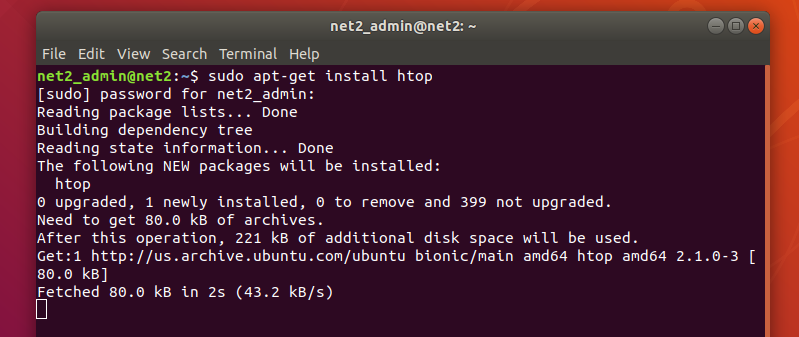
htop Linux system monitor
For more on htop, you may want to read our detailed article on Monitoring system processes in Ubuntu using htop.
vmstat ( Virtual Memory Statistics )
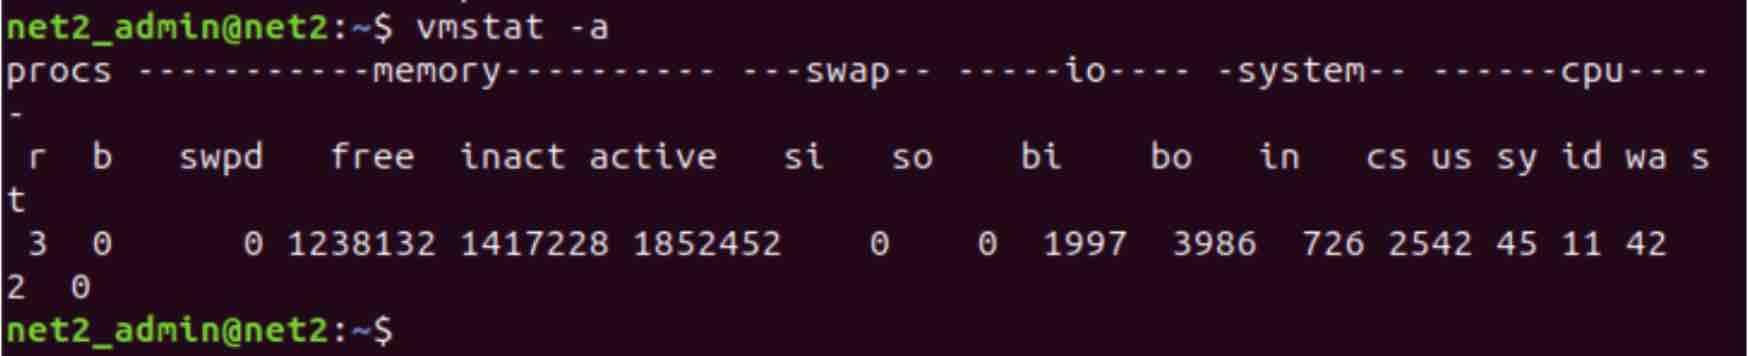
The vmstat command allows users to monitor various Linux performance metrics of their system in real-time. It can provide information about the system’s disks, CPU activity, memory usage, threads, swap usage, paging, block input/output, CPU scheduling, and other processes. To use vmstat, simply open a terminal window and enter the command. The output will show a snapshot of the current state of the system’s performance.
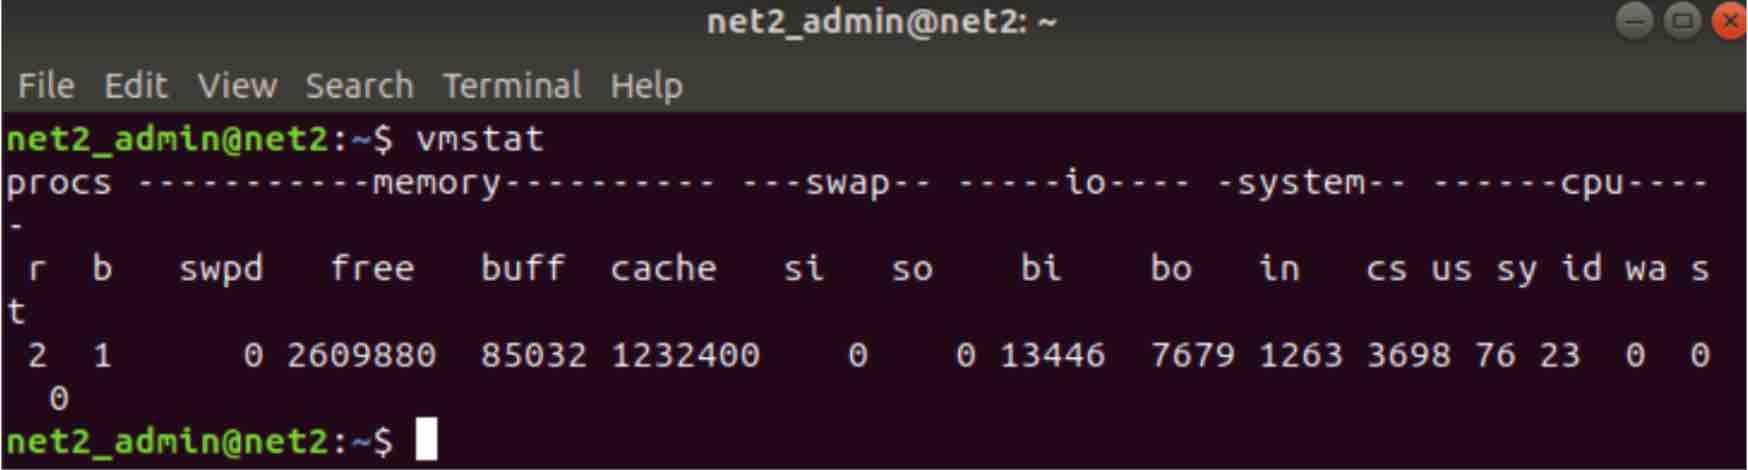
Ubuntu activity monitor : vmstat
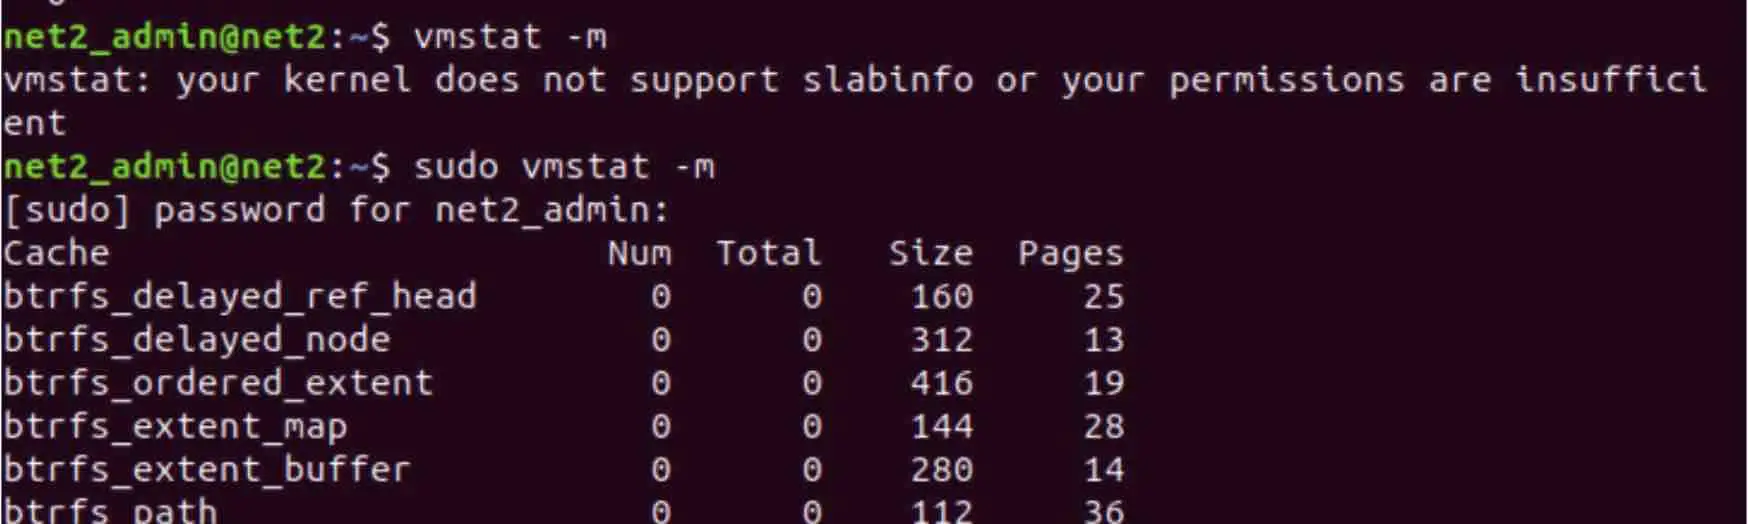
For slabinfo , you will need to have permission or add sudo with the m argument as shown below :
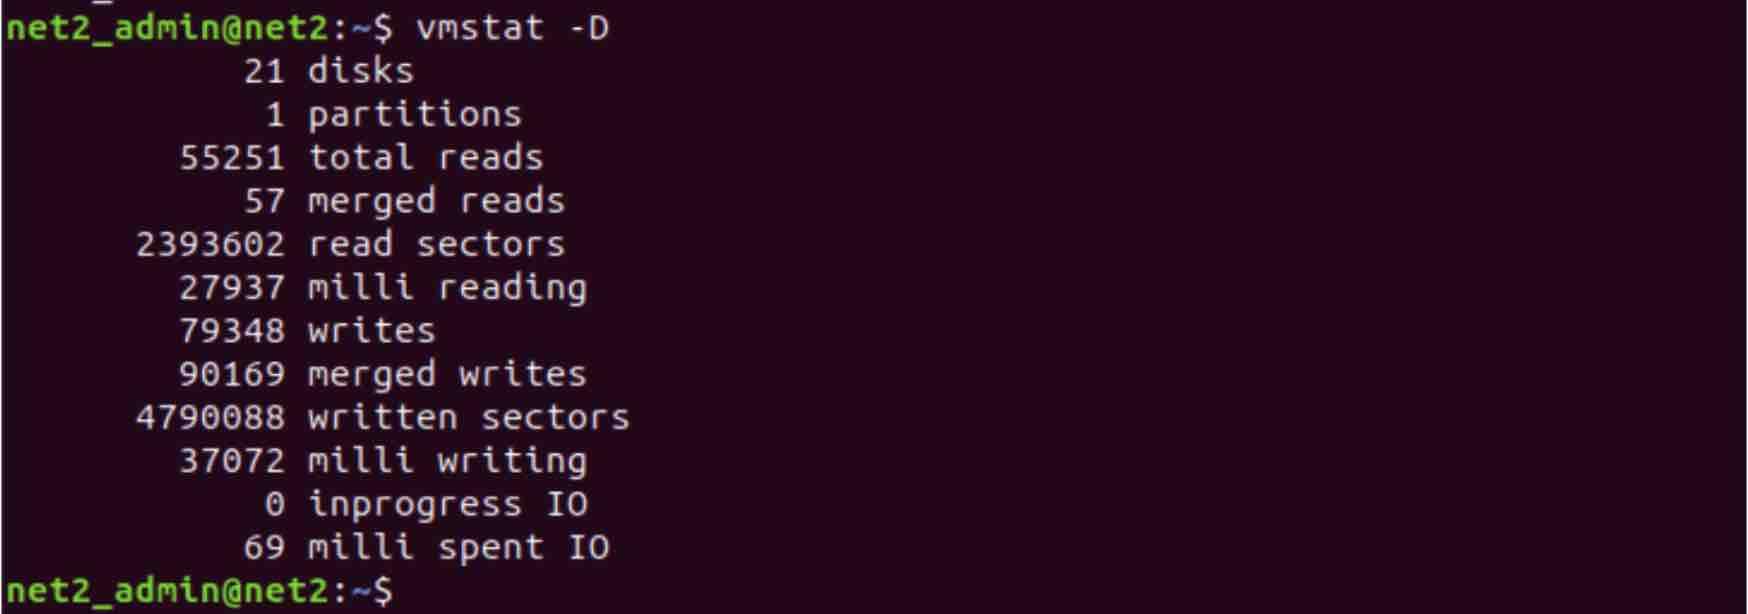
To report disk activity statistics, just type in the command with the D argument :
For information about active/inactive memory pages and swaps, use the command as shown below :
Read: What you need to do to secure Ubuntu
W command
The W utility lists the current users that are logged in and displays their current tasks . It is similar to the who command but provides more information…
if you type in the command w username, you will get one or more lines showing information about active users and what they are up to :
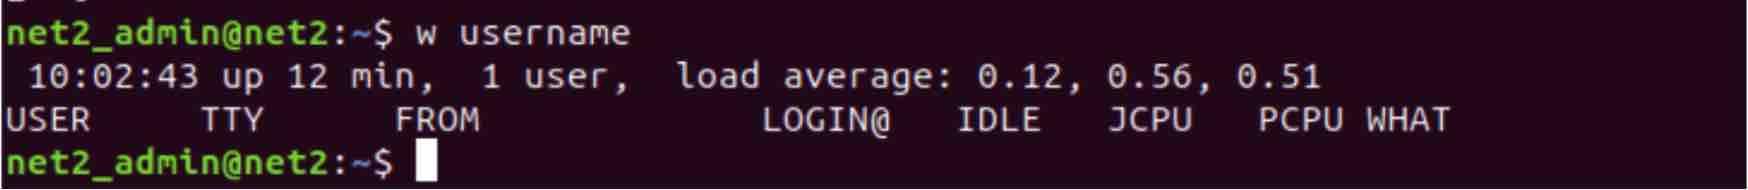
A real life example output might look like :
10:18:17 up 2 days, 11:18, 2 users, load average: 0.16, 0.26, 0.29
USER TTY FROM LOGIN@ IDLE JCPU PCPU WHAT
root pts/0 10.2.0.15 10:15 5.00s 0.03s 0.02s vmstat
root pts/1 10.2.0.15 11:13 2.00s 0.02s 0.00s top
where the columns have the following descriptions :
- USER – the name of the user.
- TTY – the type of the Terminal ( pts/0 or console).
- FROM – The remote IP address or host name .
- LOGIN@ – the Log-in time.
- IDLE – the Idle time.
- JCPU – the CPU time used by the process since login .
- PCPU – The CPU time of the current process.
- WHAT – The command line the user has executed
FREE
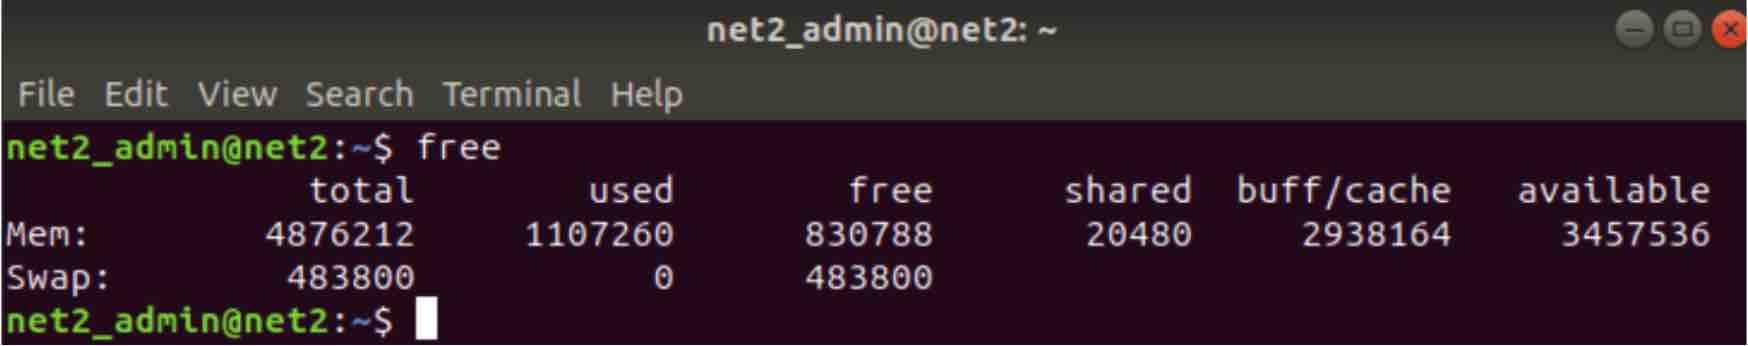
The free command is a useful tool for displaying information about available and used memory in a Linux system. It shows the total amount of free space, as well as the amount of used memory and swap space. It also includes information about buffers and caches used by the kernel. This tool is essential for managing memory in a Linux system.
If you type in free, you will get something similar to :
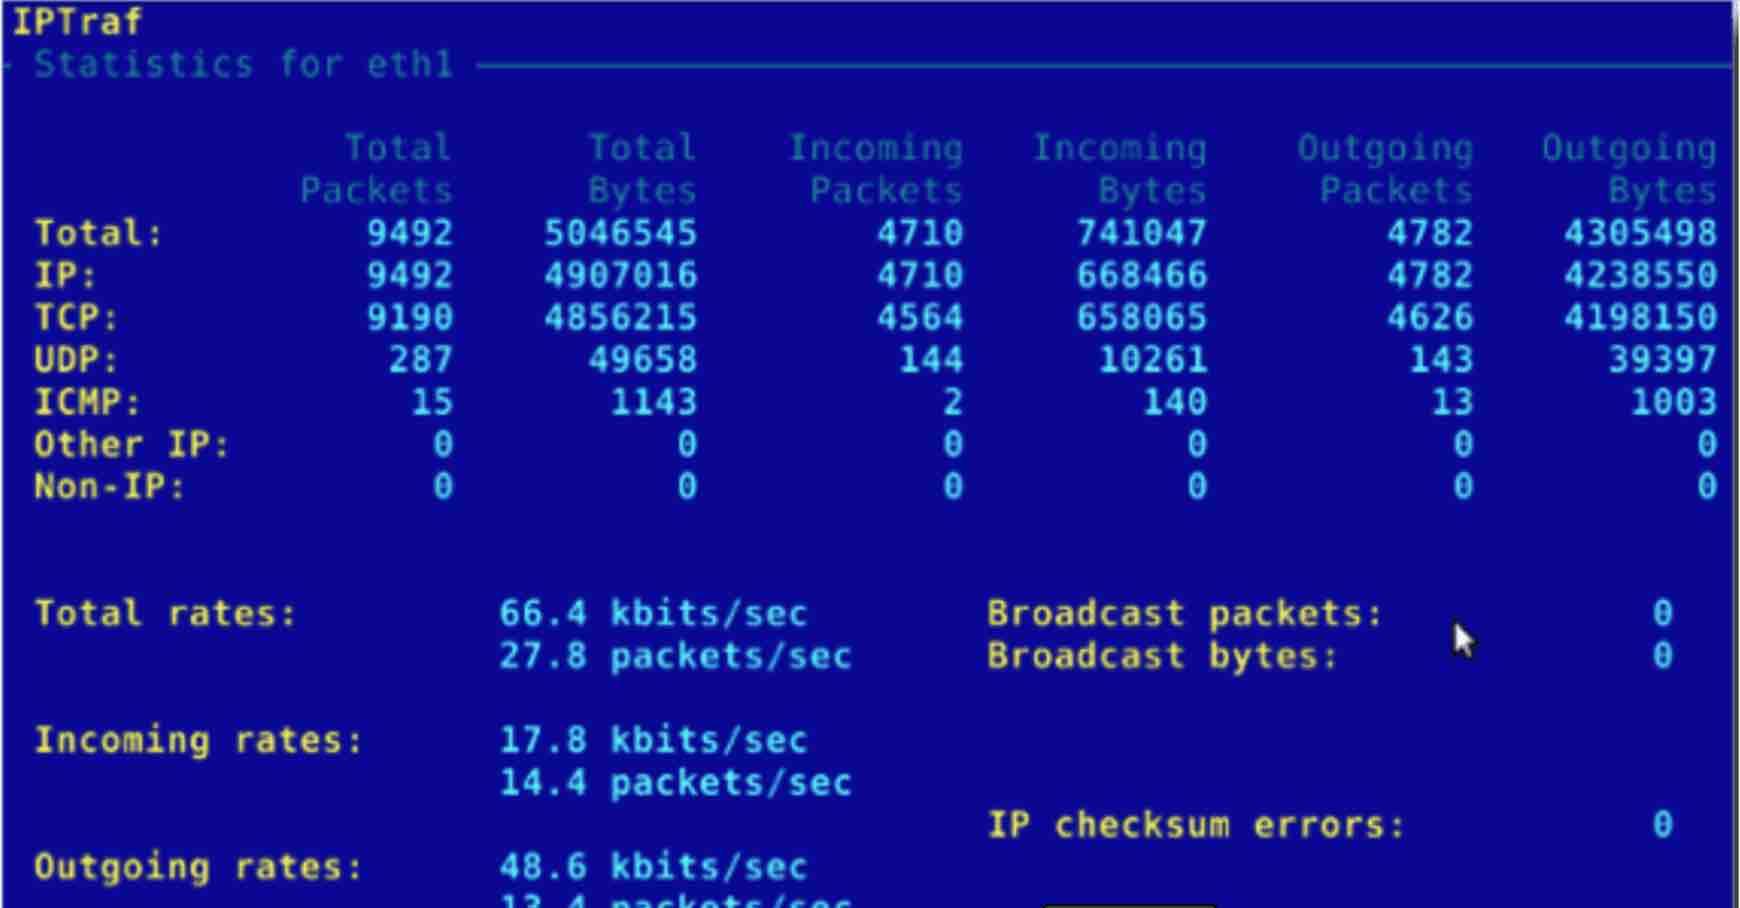
Iptraf – Linux network performance monitoring utility
iptraf command tool is a colorful interactive IP LAN monitor. Based on ncurses IP LAN monitor, it generates different network statistics such asUDP counts, TCP info, OSPF and ICMP information, node stats, Ethernet load info, IP checksum errors, and others.
ss
Much like netstat, ss (socket stats) command tool is used to dump socket statistics. It can provide additional TCP and state information when compared to other tools.
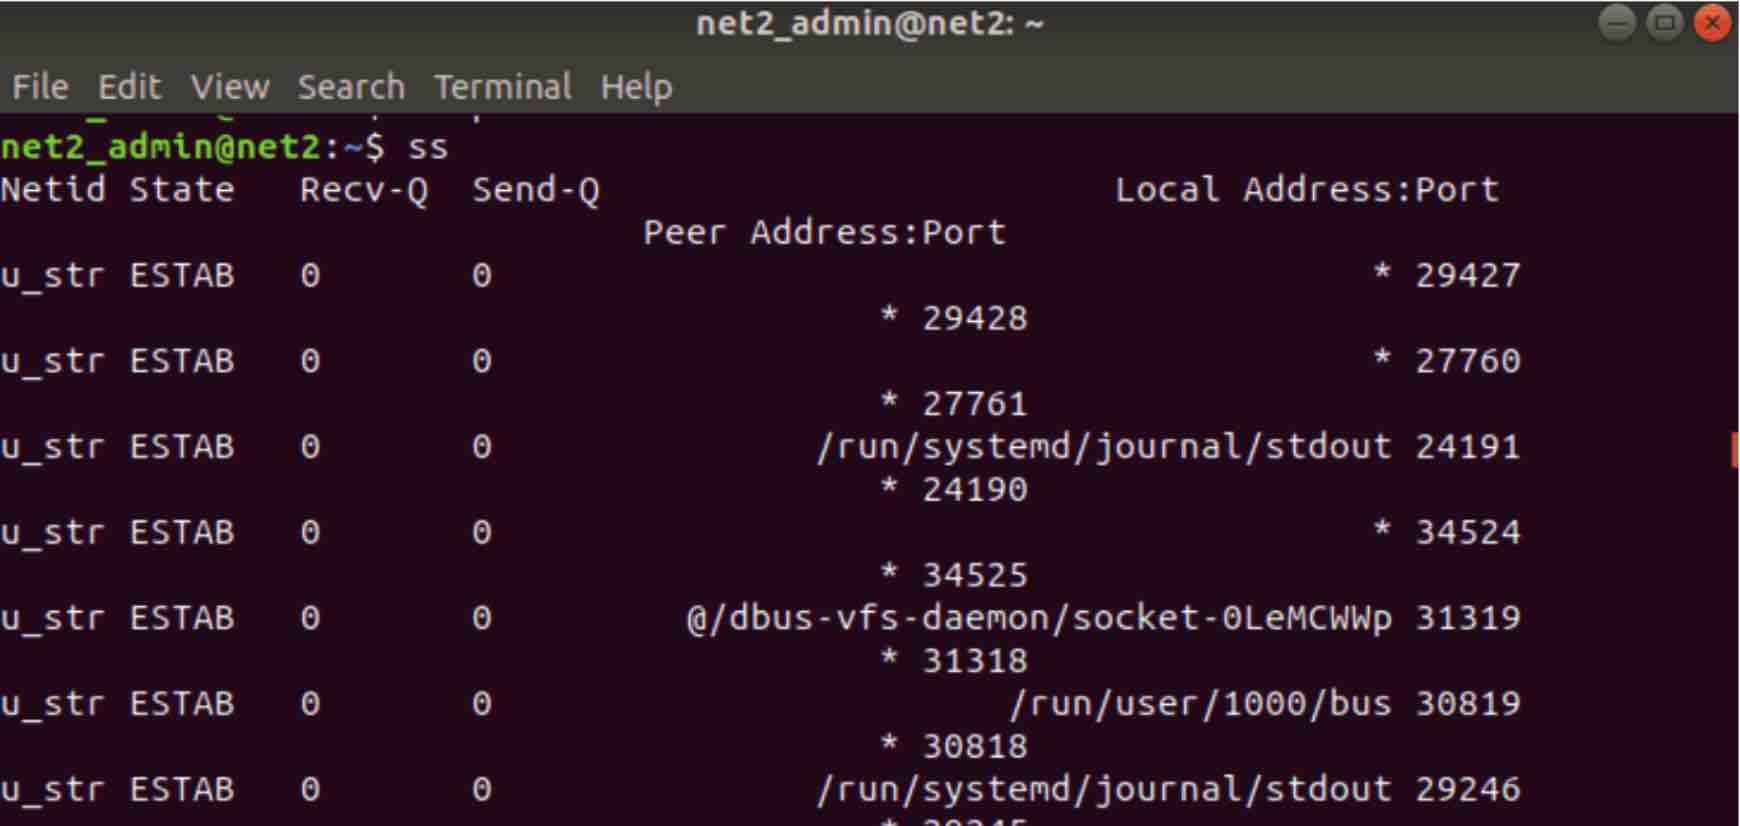
ss has many options. open up the man page to display them.
UPTIME
If you want to know, how much time the system has been active, then you are in the right place. uptime tells the time during which the system has been up and running.
if you type in uptime in the terminal, you will get an output similar to the following :
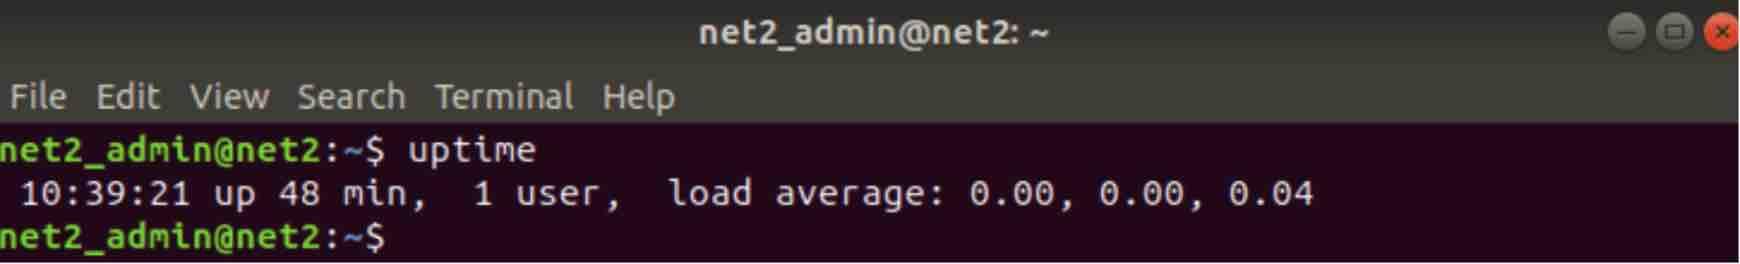
As you can see, the command uptime returns the current time as well as the amount of time the system has been running along with the number of logged-on users and finally the load time for the past 1 minute, 5 minutes and 15 minutes respectively.
Justniffer – Network TCP Packet Sniffer
Justniffer is a utility that captures and analyzes TCP packets and network protocol data, including both low and high level traffic. It is specifically designed to log data from Apache web server log files and provides a customized output. Justniffer can intercept and retrieve all files from HTTP traffic, track response times, and allow users to trace tcp network traffic from a captured file or live network.
Read: How to install Apache web server on Ubuntu
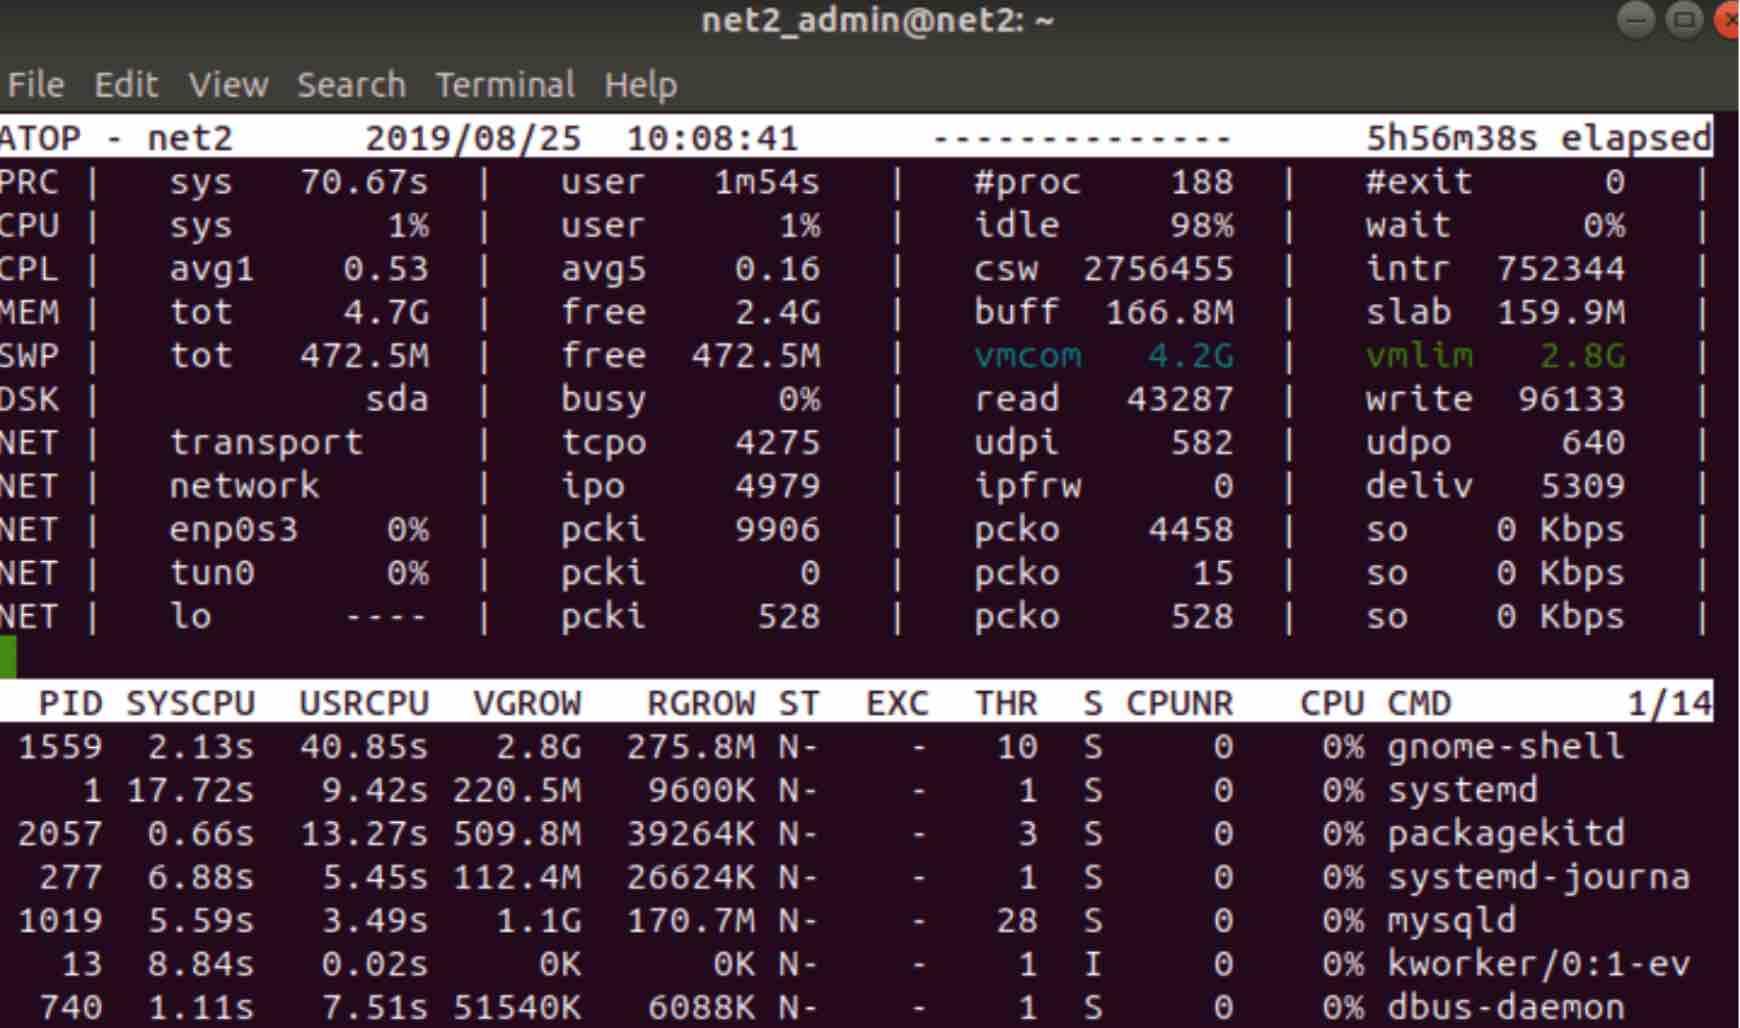
atop
atop is an interactive monitoring tool for Linux systems that provides detailed information about processes causing high CPU, memory, disk, or network usage. It displays the current load on the system and can identify the specific processes that are causing any resource strain.
Once you install atop via the terminal, run it by invoking the atop command :
IOSTAT
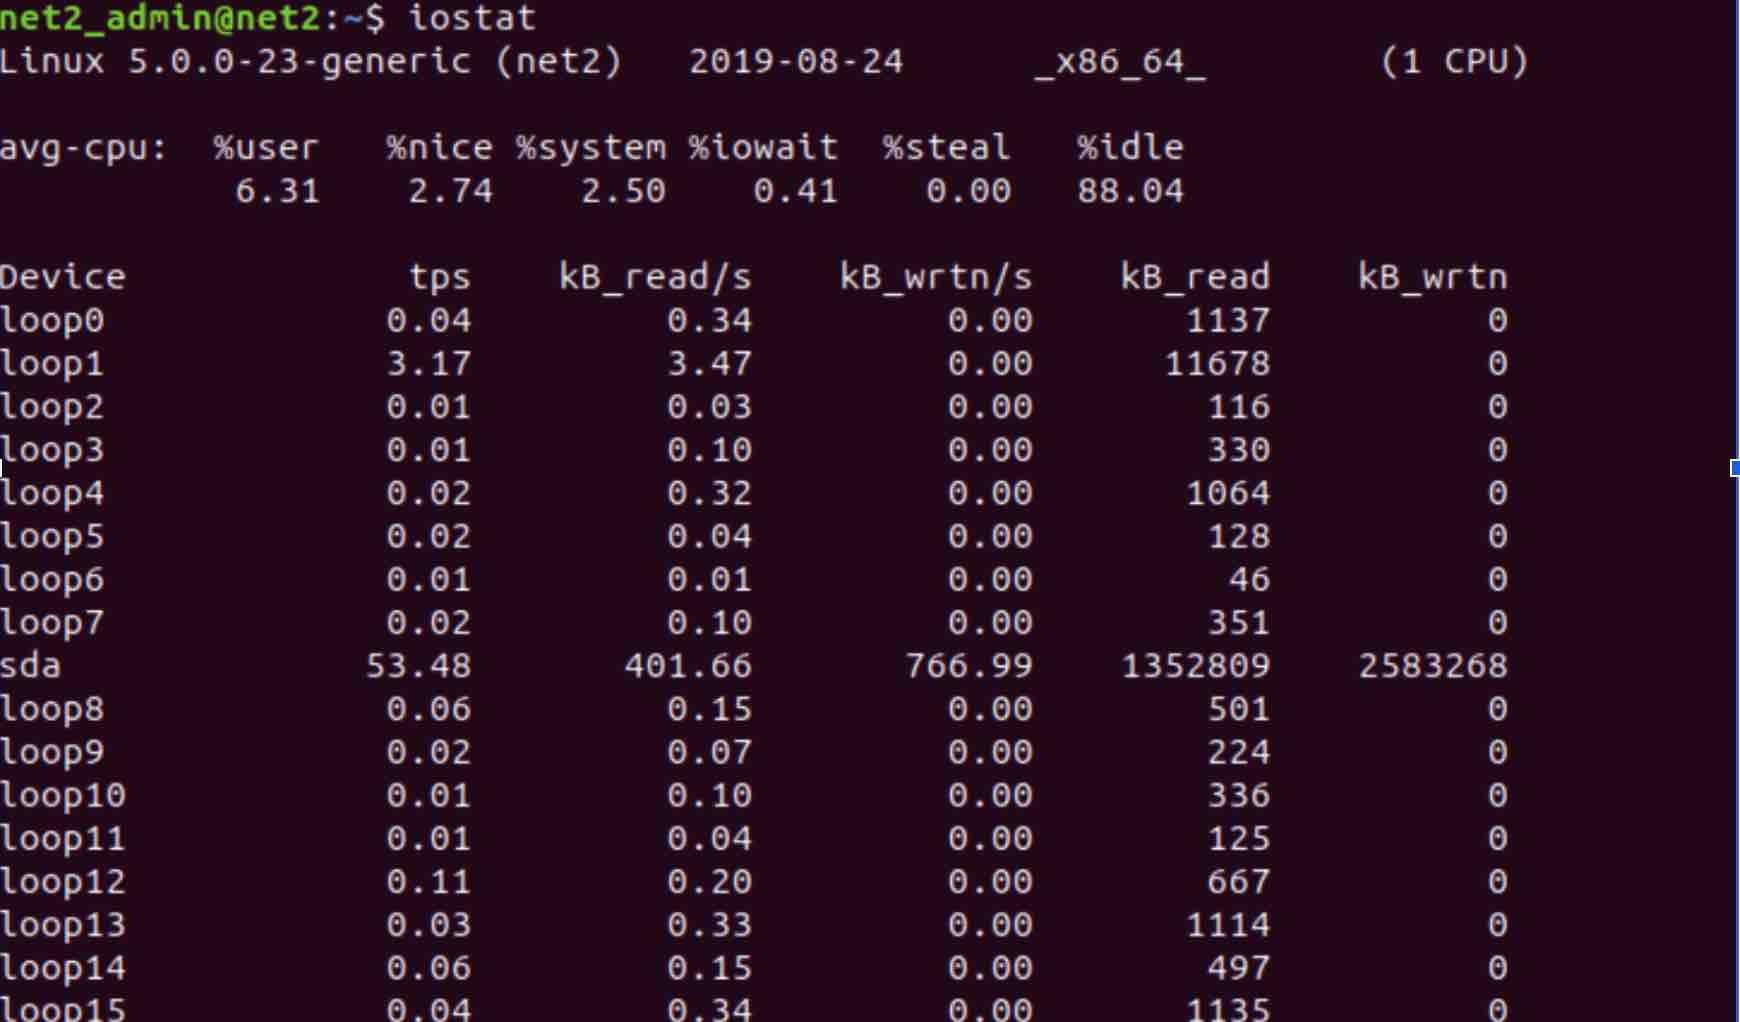
The iostat tool shows and collects data about the input and output performance of a system’s storage devices, including local and remote disks. It is frequently used by system administrators to identify any issues with storage devices that may affect performance.
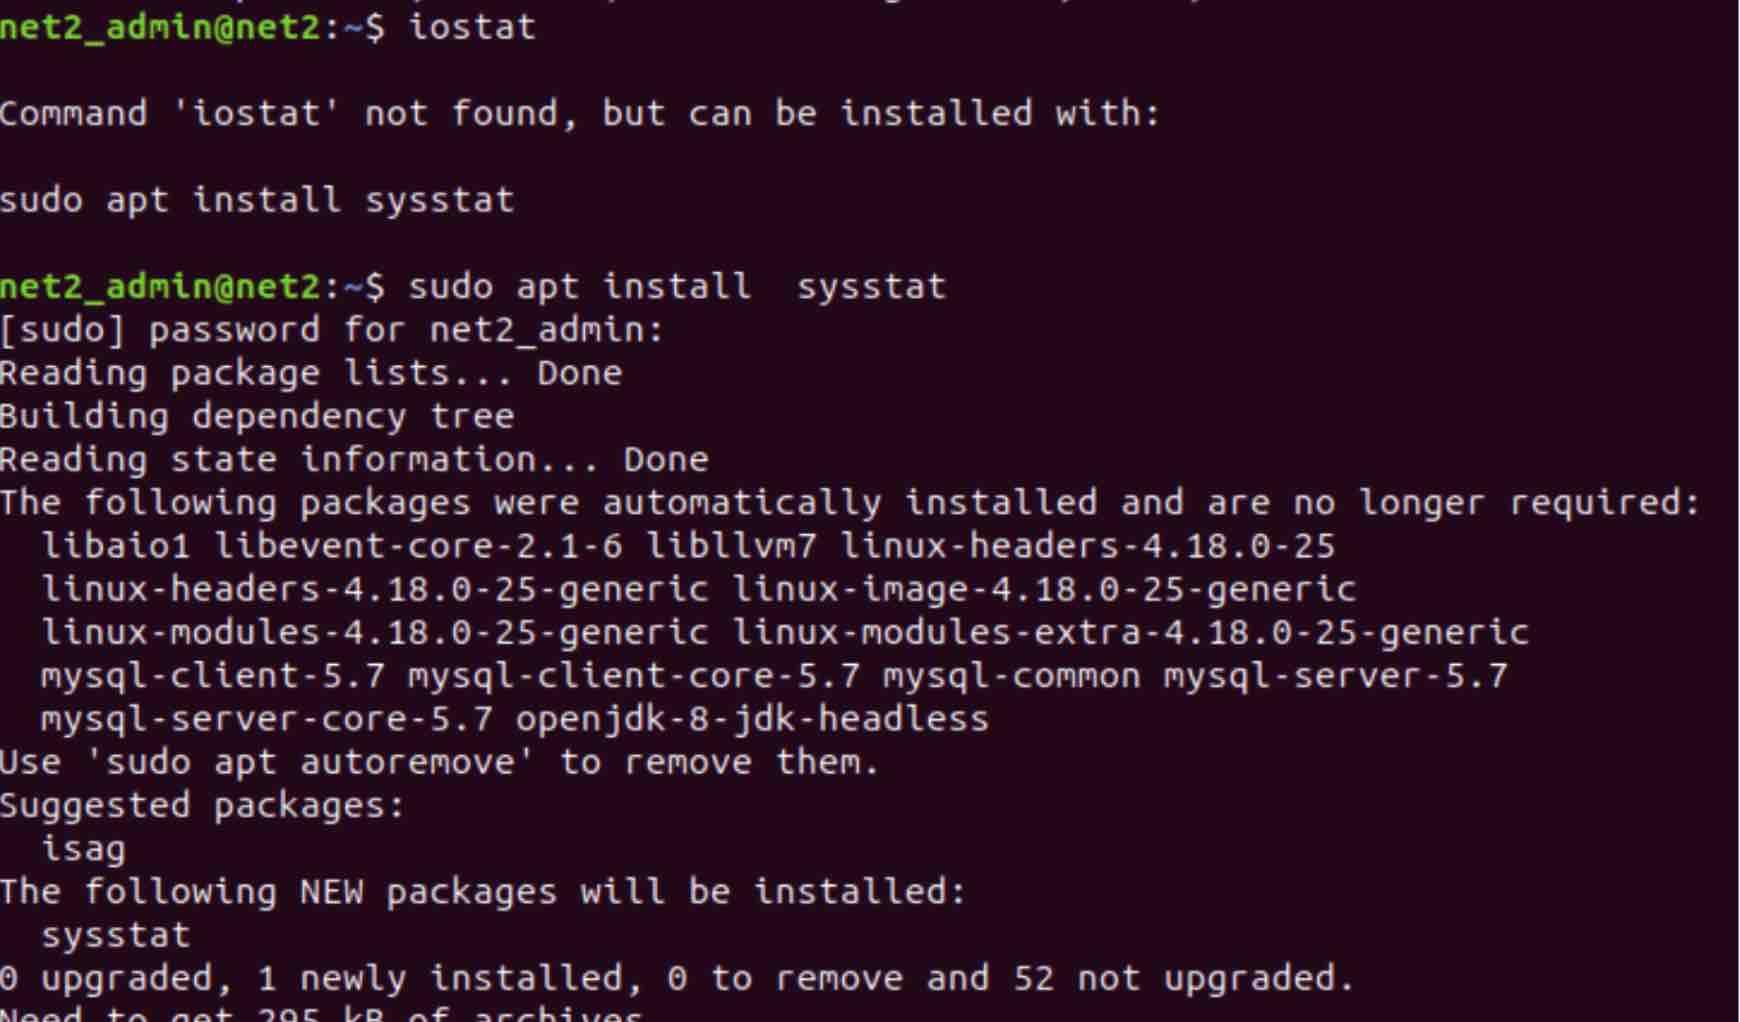
if might be that iostat is not installed by default on your system , in this case you can install it via the package sysstat as shown below :
if you type in iostat, you will end up having an output which might look similar to the one below :
PS
Common tool used to display active-processes related information.
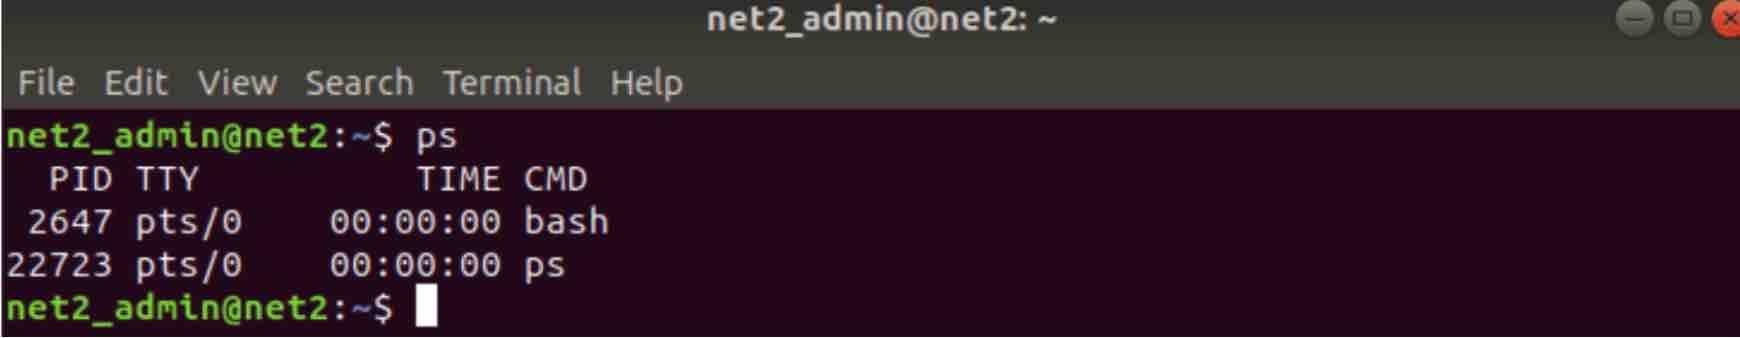
PID: Process ID, shows the process identification number.
TTY: Identifies the terminal from which the process was executed.
TIME: Shows the processor’s time occupied by the program.
CMD: Shows the command used to launch the process.
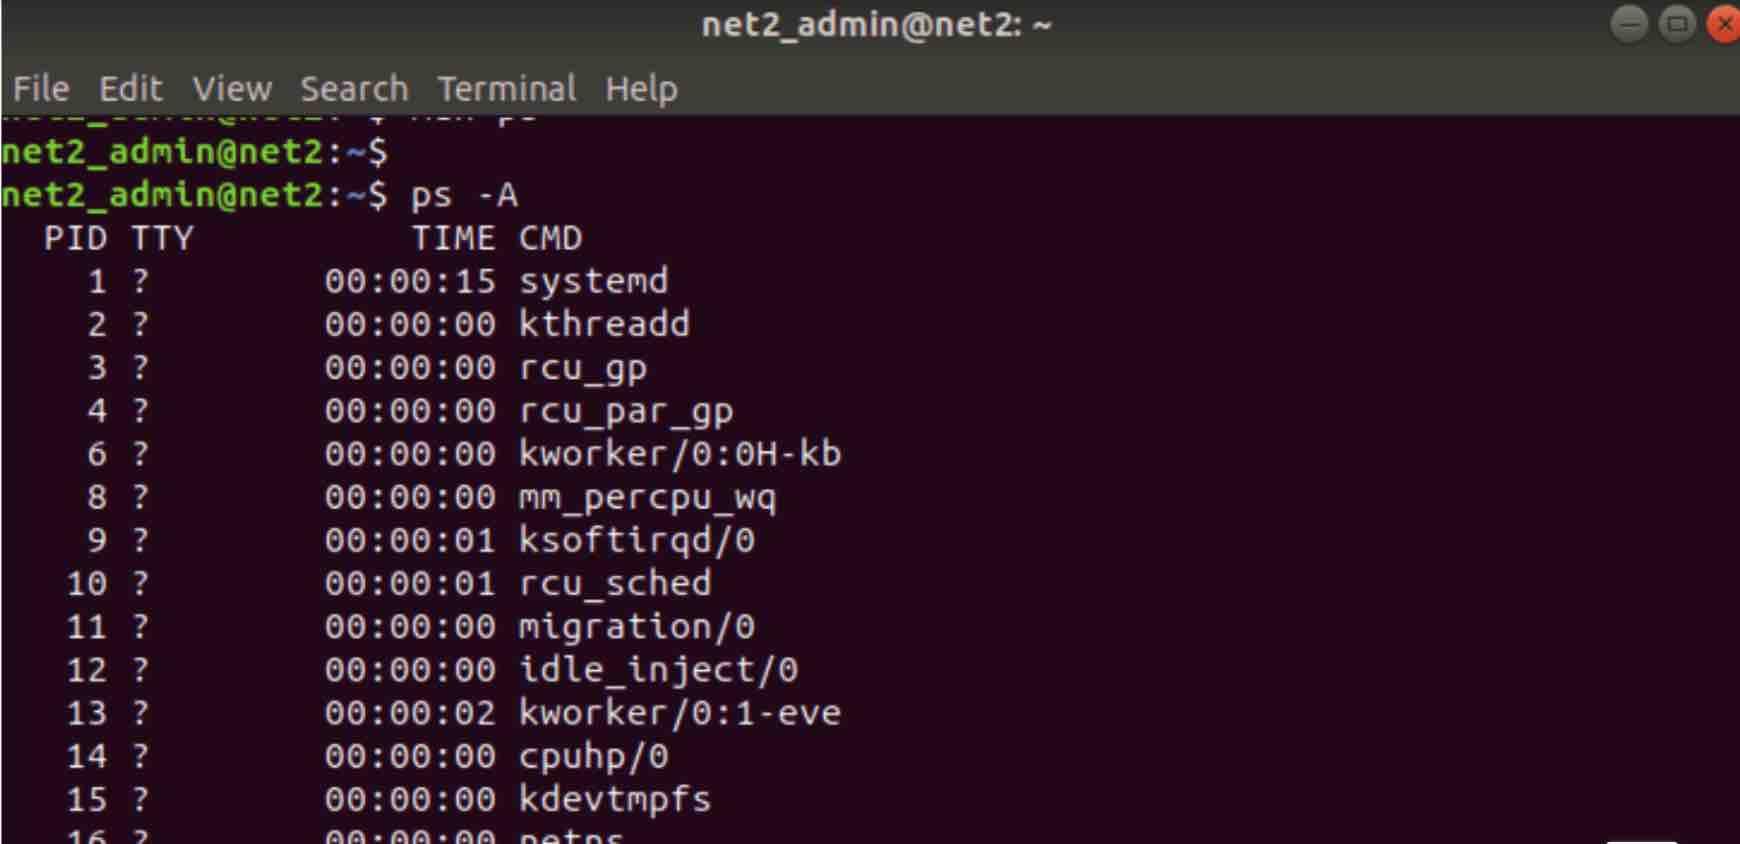
If you want to display all running processes , use the command ps -a :
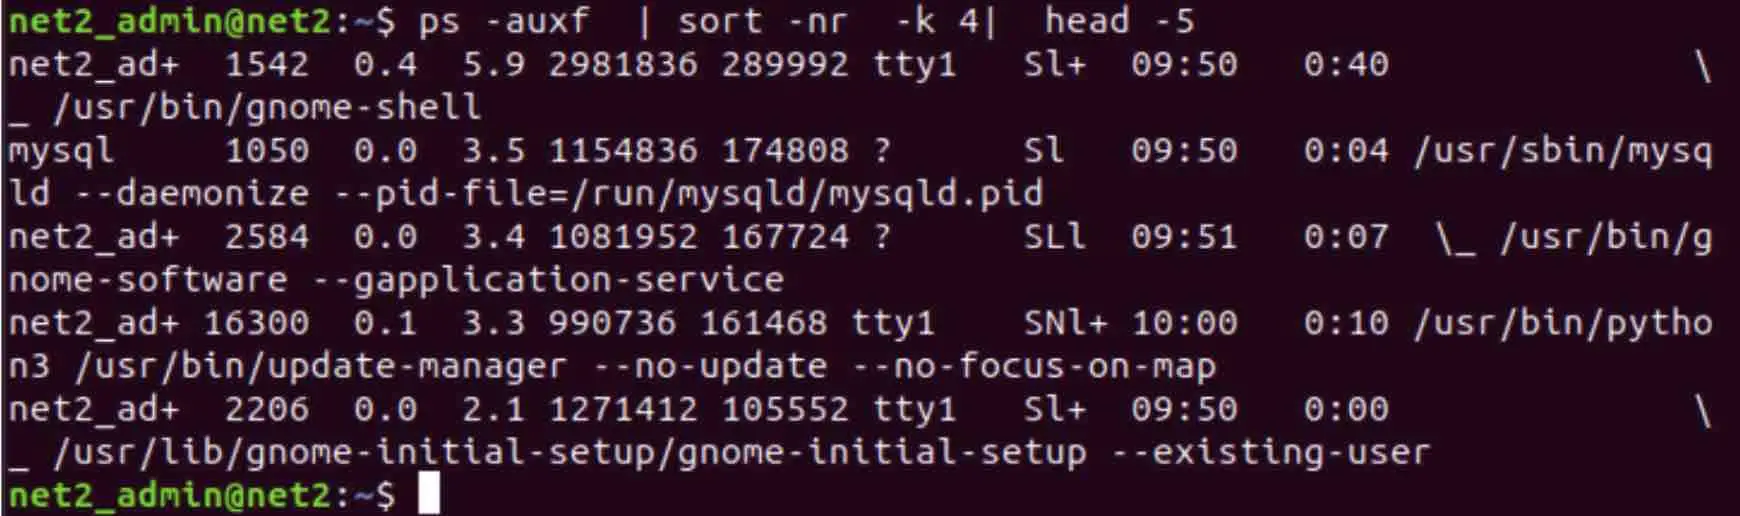
if you want to display the top 5 Memory Consuming Processes, run the command as shown below :
# ps -auxf | sort -nr -k 4 | head -10
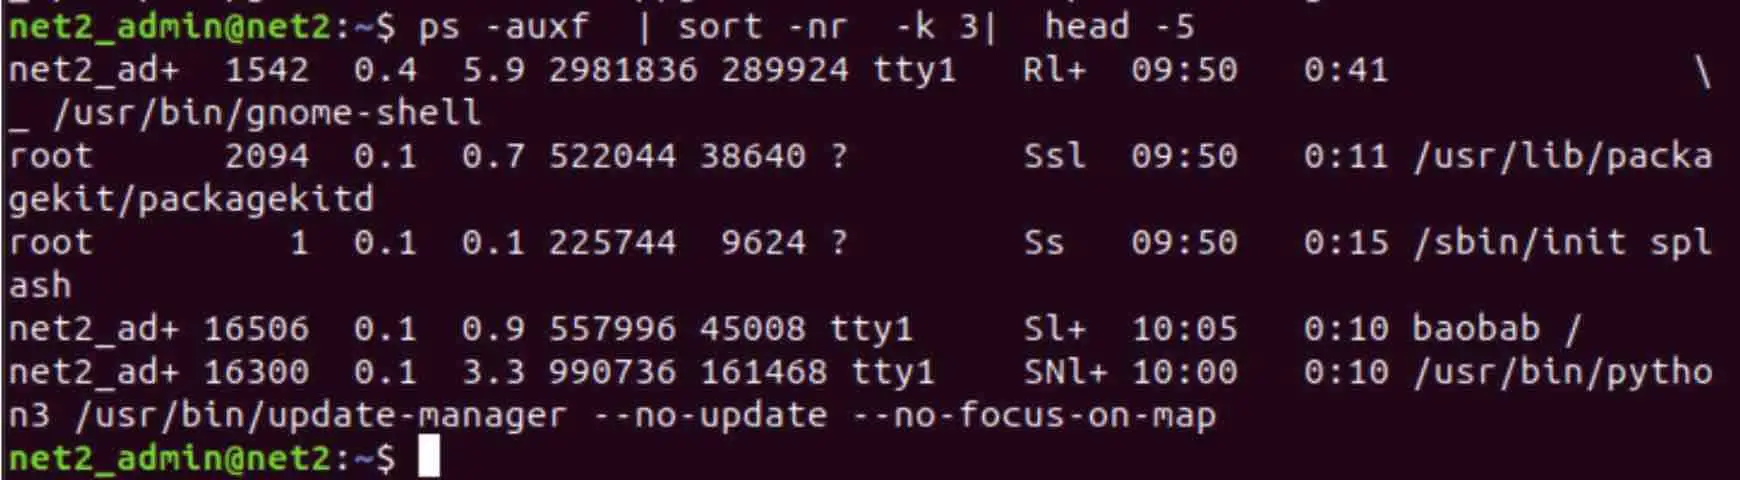
and in order to view the top 5 CPU Consuming Processes, type in the command below :
# ps -auxf | sort -nr -k 3 | head -5
MUNIN
Munin is GUI monitoring application for systems and networks. It has a client-server based architecture and can be configured to carry out monitoring activities on the ‘main’ machine (the Munin master) it’s installed on and on the connected client machines (Munin nodes )
Here is a snapshot of the munin tool :
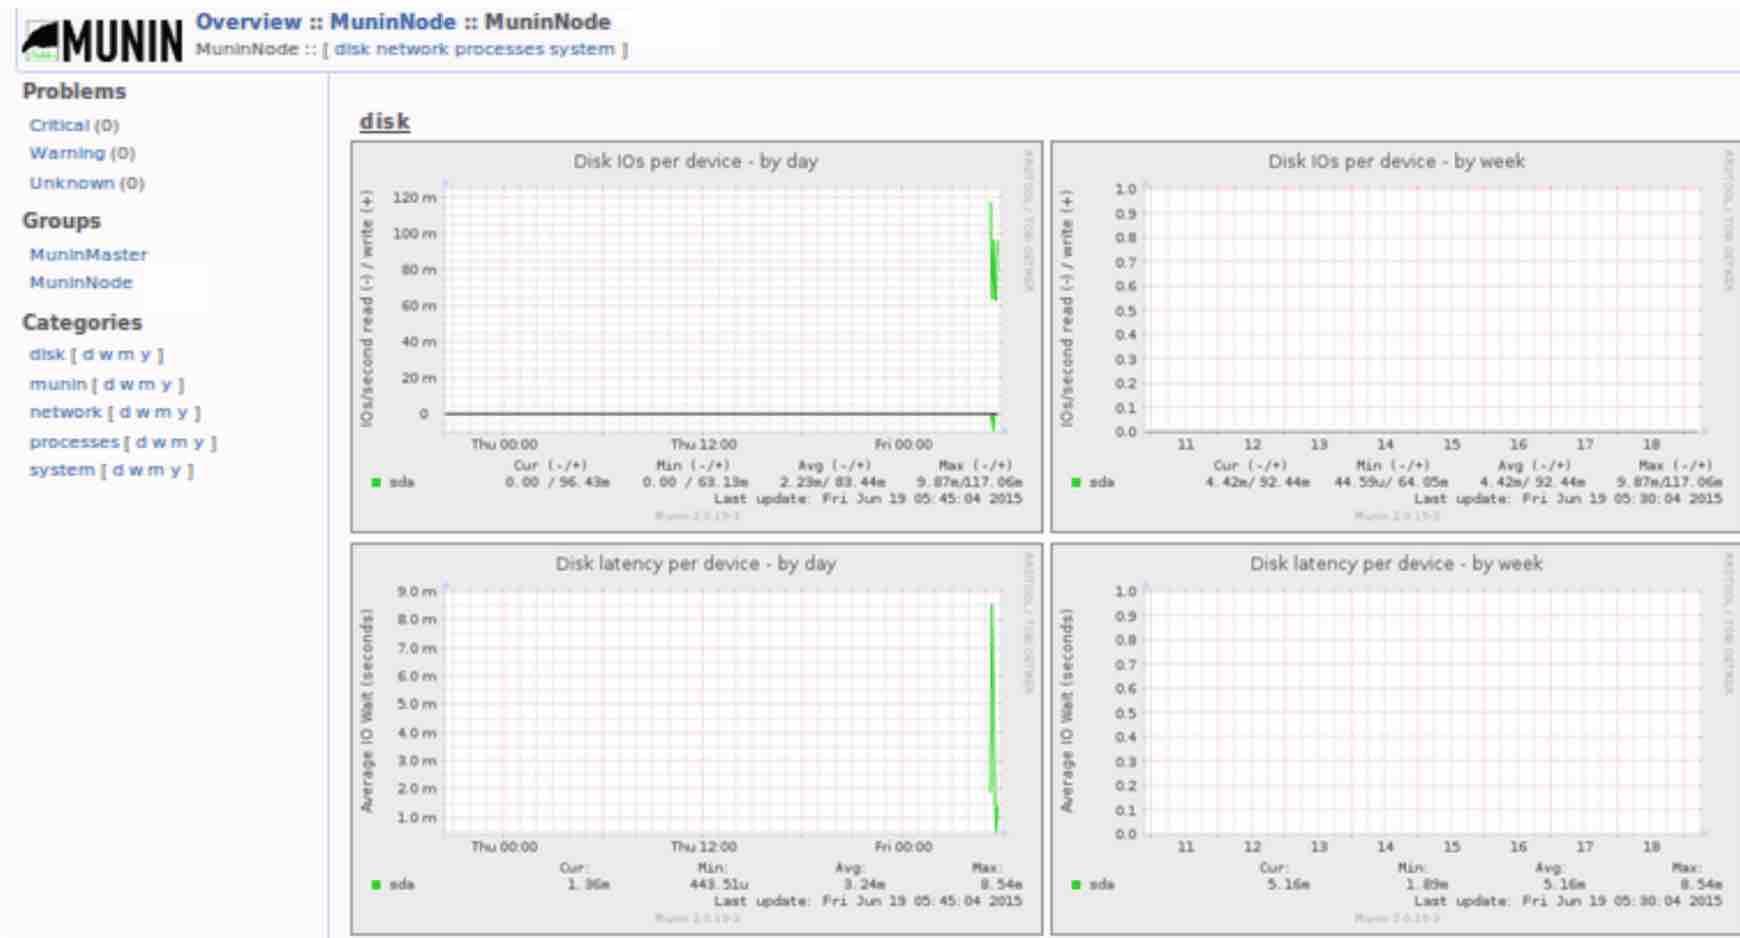
for more on munin, please visit : http://munin-monitoring.org/wiki/Documentation.
GANGLIA
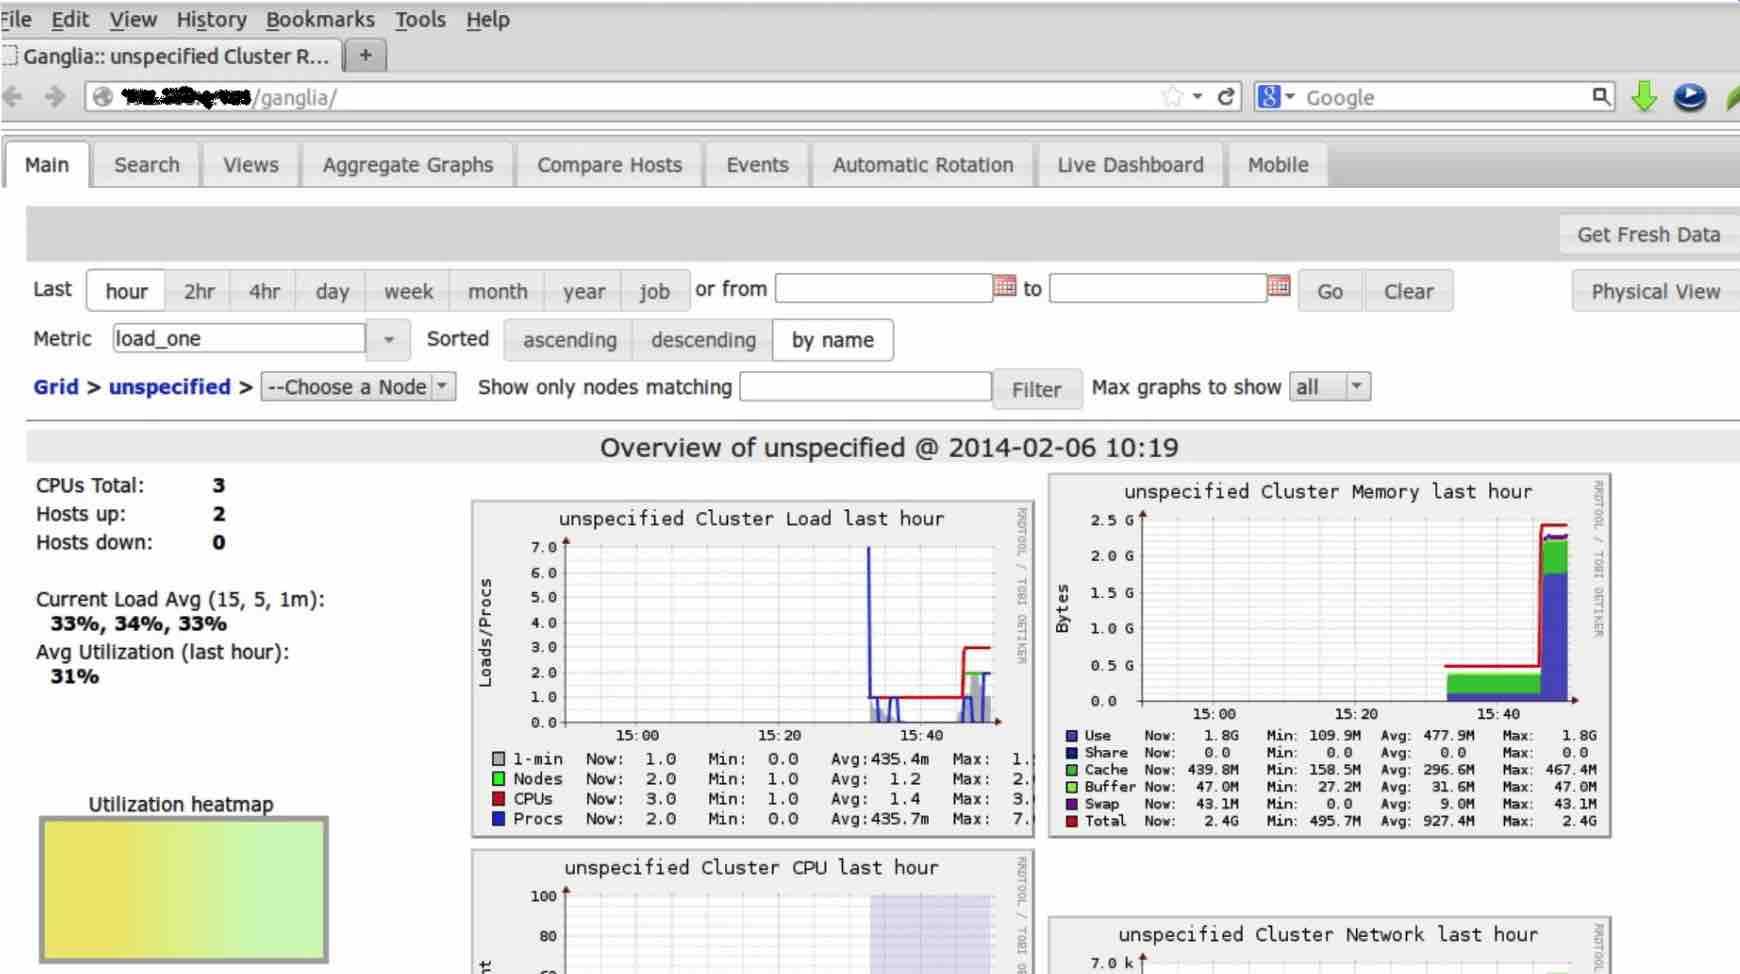
Ganglia is a monitoring tool designed for high-performance networks, computing systems, and clusters. It is capable of displaying live or recorded statistics on various metrics such as network usage, CPU load averages, and more for multiple nodes. Ganglia is distributed and scalable
Here is what it looks like :
DSTAT performance monitor for Linux
Dstat provides valuable information about your system performance like CPU activity, virtual memory , i/o devices and many more. It actually replaces some older utilities such as iostat, ifstat, vmstat, netstat and ifstat.
If you have not installed dstat you proceed as shown below :
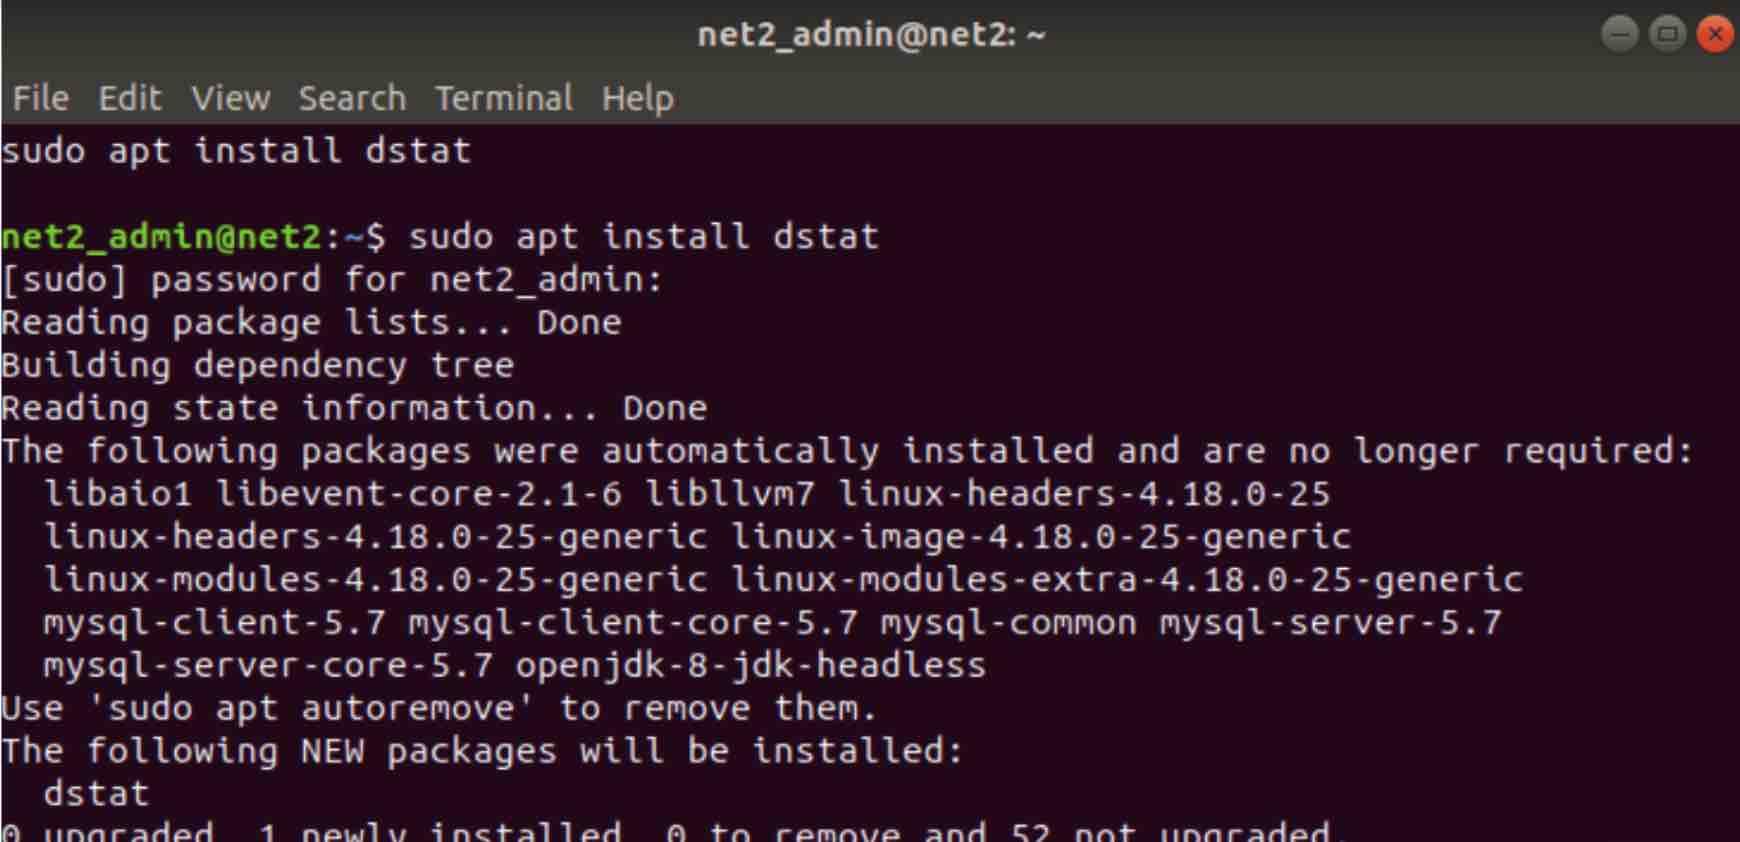
Once this is done, you can simply type in dstat :
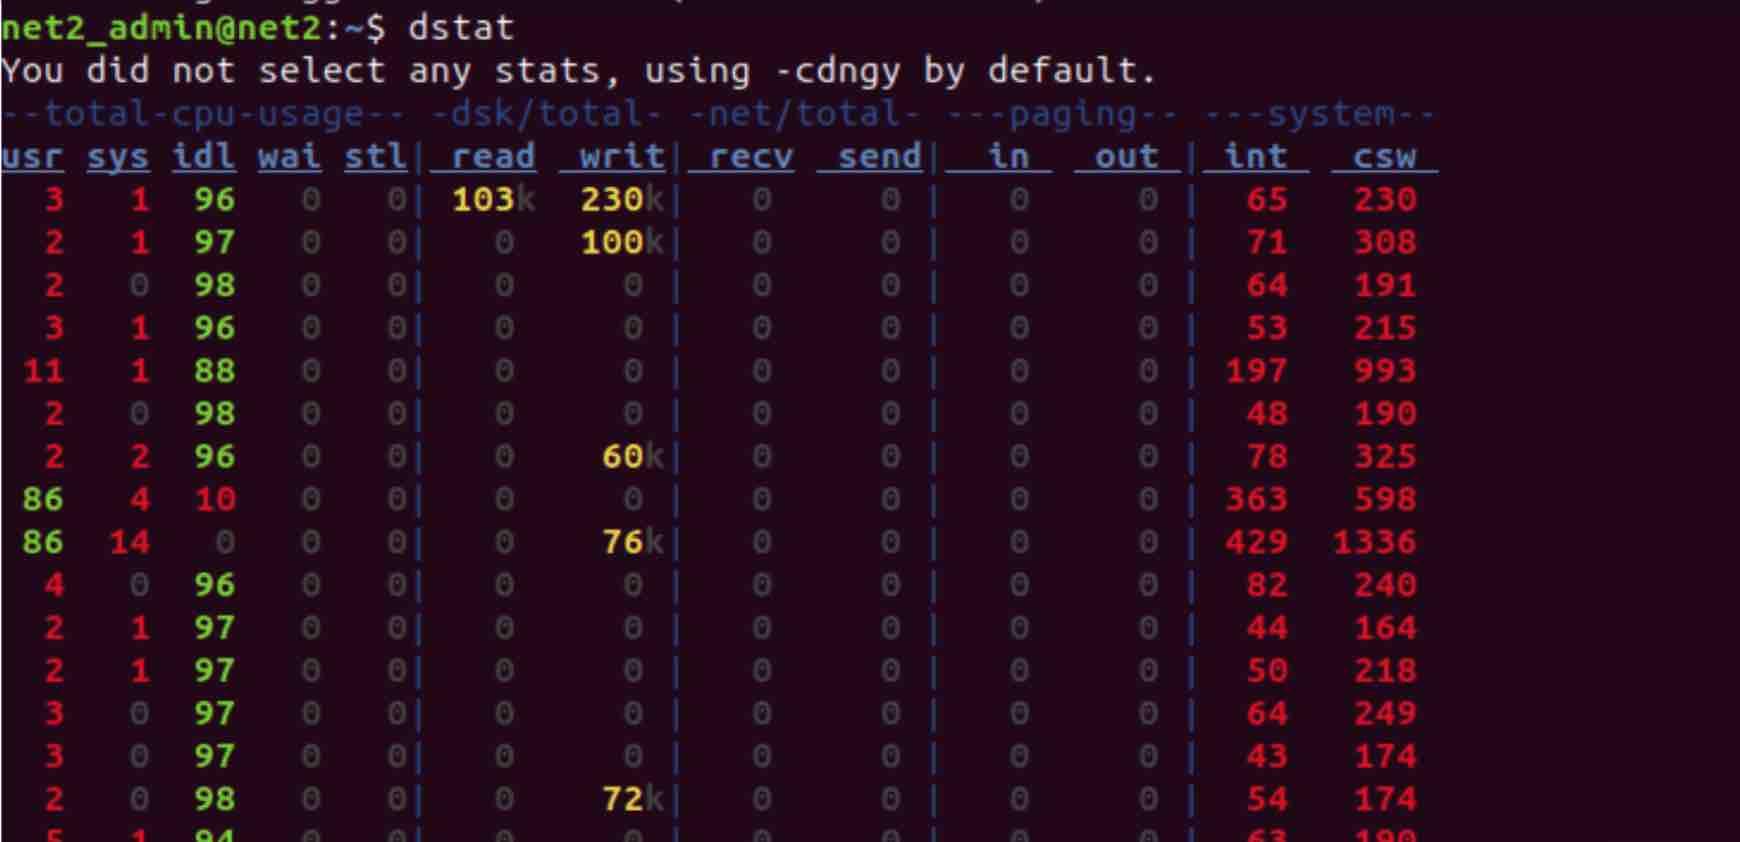
If no options have been added with the command dstat, it will use a default set of options, as shown above (-cdngy) . The output above shows the following information :
- CPU stats: cpu usage by :
– a user (usr) processes
– a system (sys) process,
– the number of idle (idl) processes
– the number of waiting (wai) processes .. - Disk stats: total number of read and write operations on disks.
- Network stats: total number of bytes received (recv) as well as sent (send) on network interfaces.
- Paging stats: number of ‘in’ and ‘out’ copy operations on the memory.
- System stats: number of interrupts (int) events and context switches (csw) events .
In order to hide the warning message displayed at the start of the result,”You did not select any stats” you can simply insert the -a option.
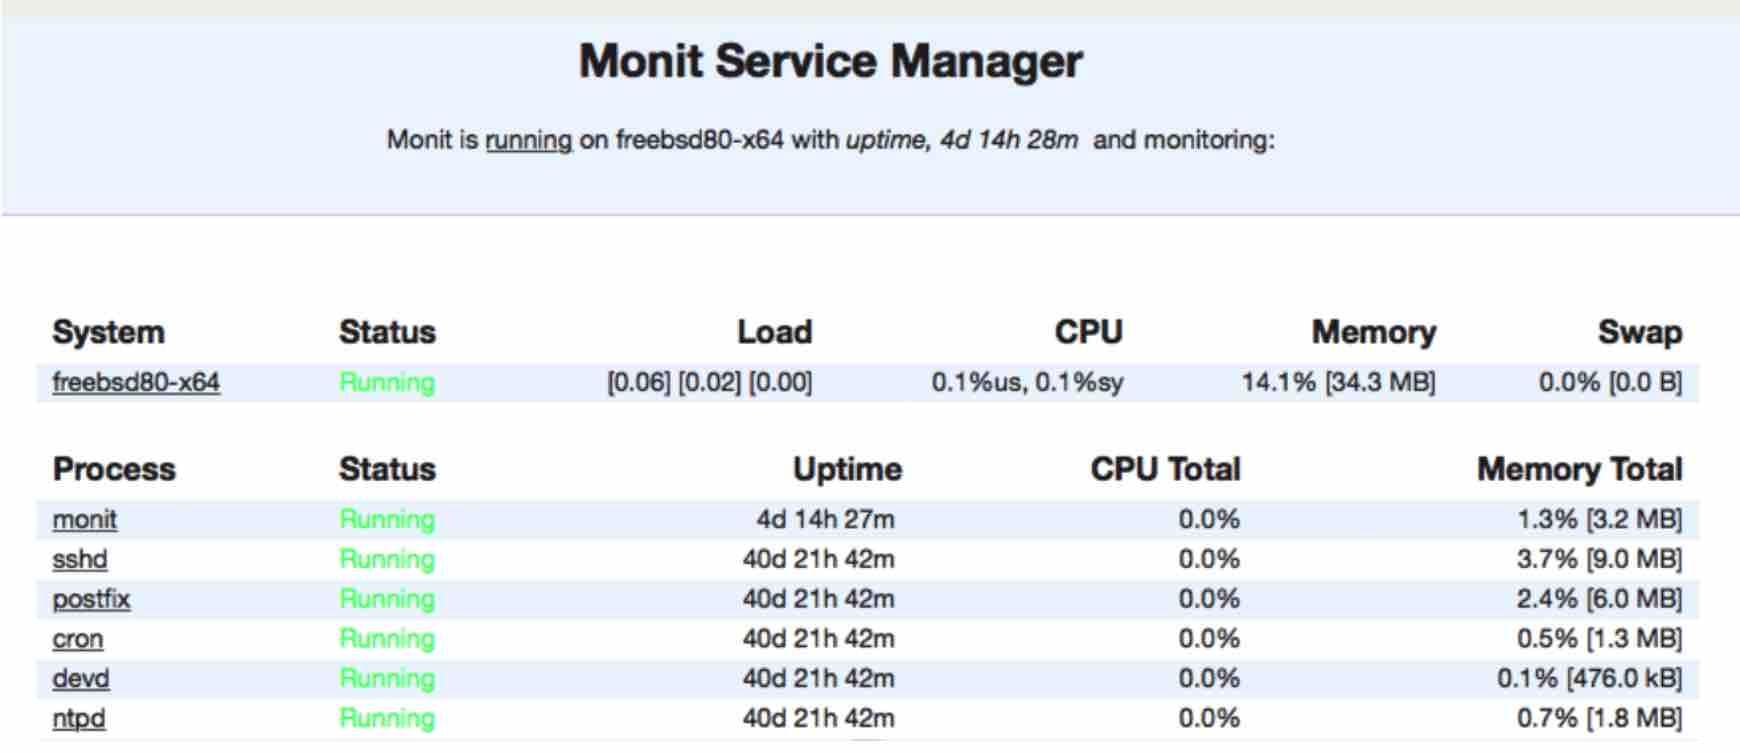
MONIT
Monit is an open source tool that can be used to monitor various processes on a server, including web servers like Apache or Nginx. It has a lightweight web-based interface that allows users to check the status of all monitored services and perform automatic repairs and maintenance
collectl
Collectl is a Linux performance monitoring tool that gathers data about the current state of the system. This open source command-line utility functions like many other Linux performance monitoring commands such as ps, vmstat, and top, and is capable of both recording and playing back collected data. With a low CPU usage of less than 0.1%, Collectl can provide valuable information about the system’s performance without significantly impacting its performance
17. PMAP
Pmap is yet another open source network monitoring application that helps look up the complete address space of a specific process. It shows the memory usage map or address space of one or many processes.
Pmap is a Sun OS tool and only very limited number of features are supported by Linux.
SAR
SAR ( System Activity Report ) is a tool used to report and collect information about CPU performance, Network monitoring, Disk usage, Memory I/O devices consumption, battery performance and many more. It generates the reported information on the fly and can store it in the specified file as well using the -o filename option.
In order to start using SAR, you would need to install it first like we did with the iostat above:
sudo apt install sysstat
Once this is done, you would need to enable data collection. You can do this by marking ENABLED=”true” in /etc/default/sysstat in Ubuntu for instance.
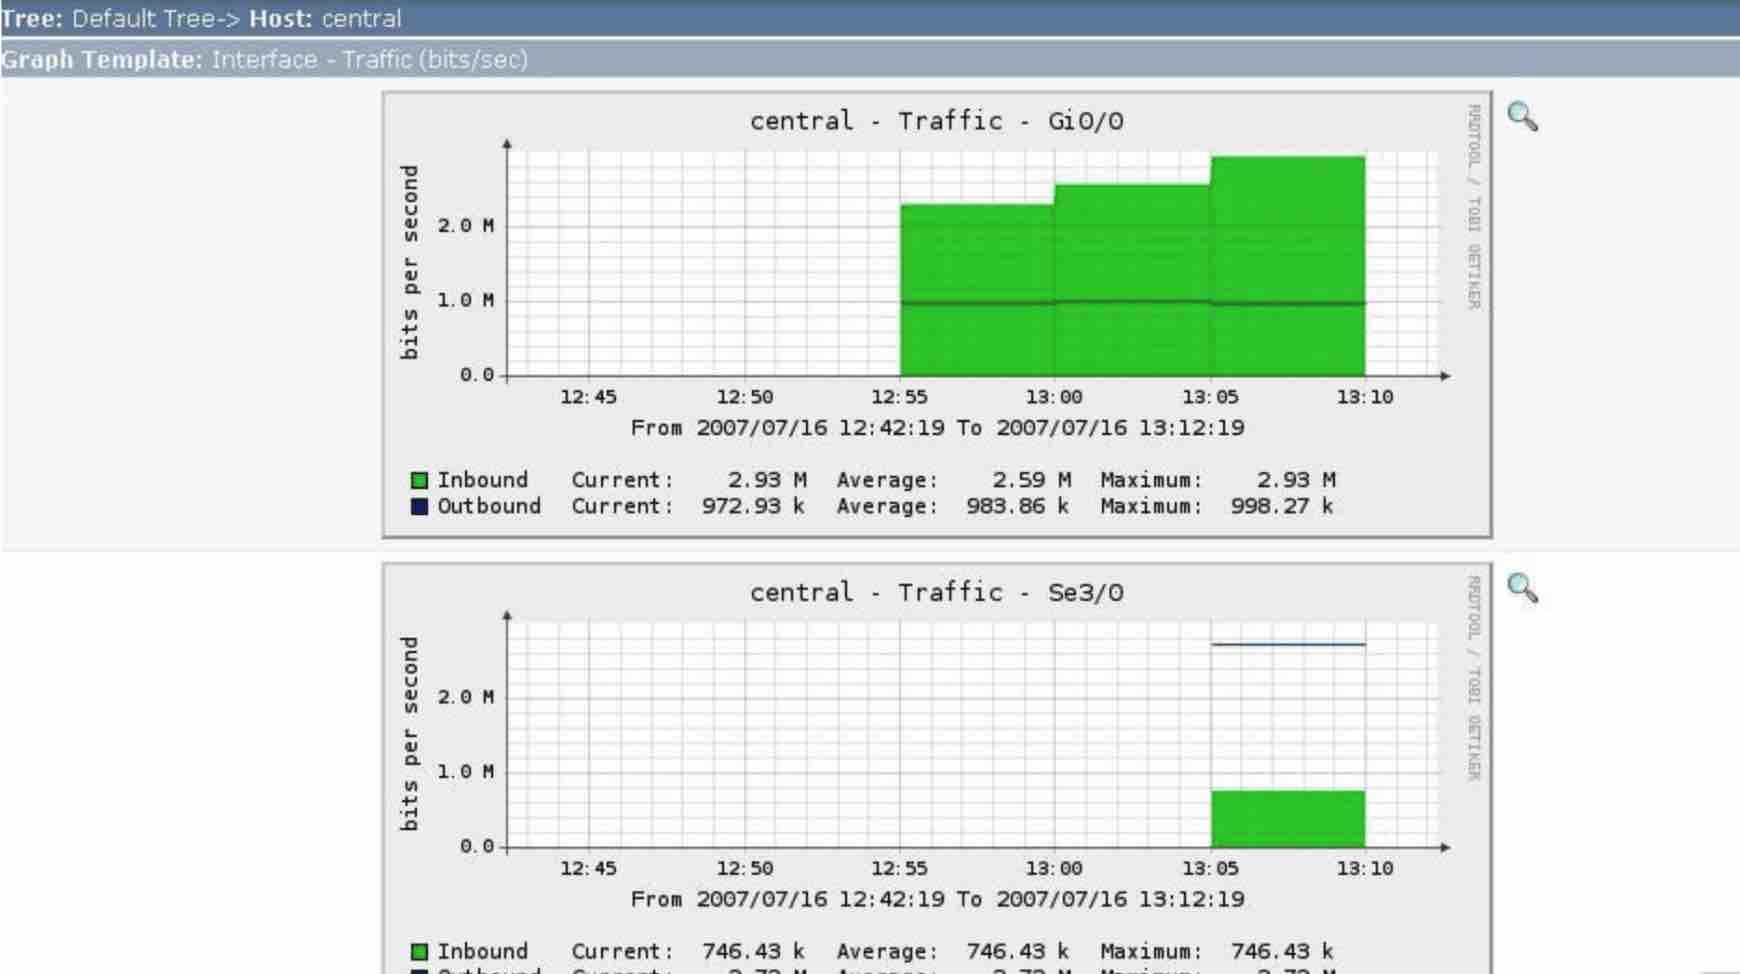
Cacti
Cacti is an open source utility used to monitor networks and network devices, such as routers, switches and servers. Cacti has a web interface which can be configured and administered by end-users .
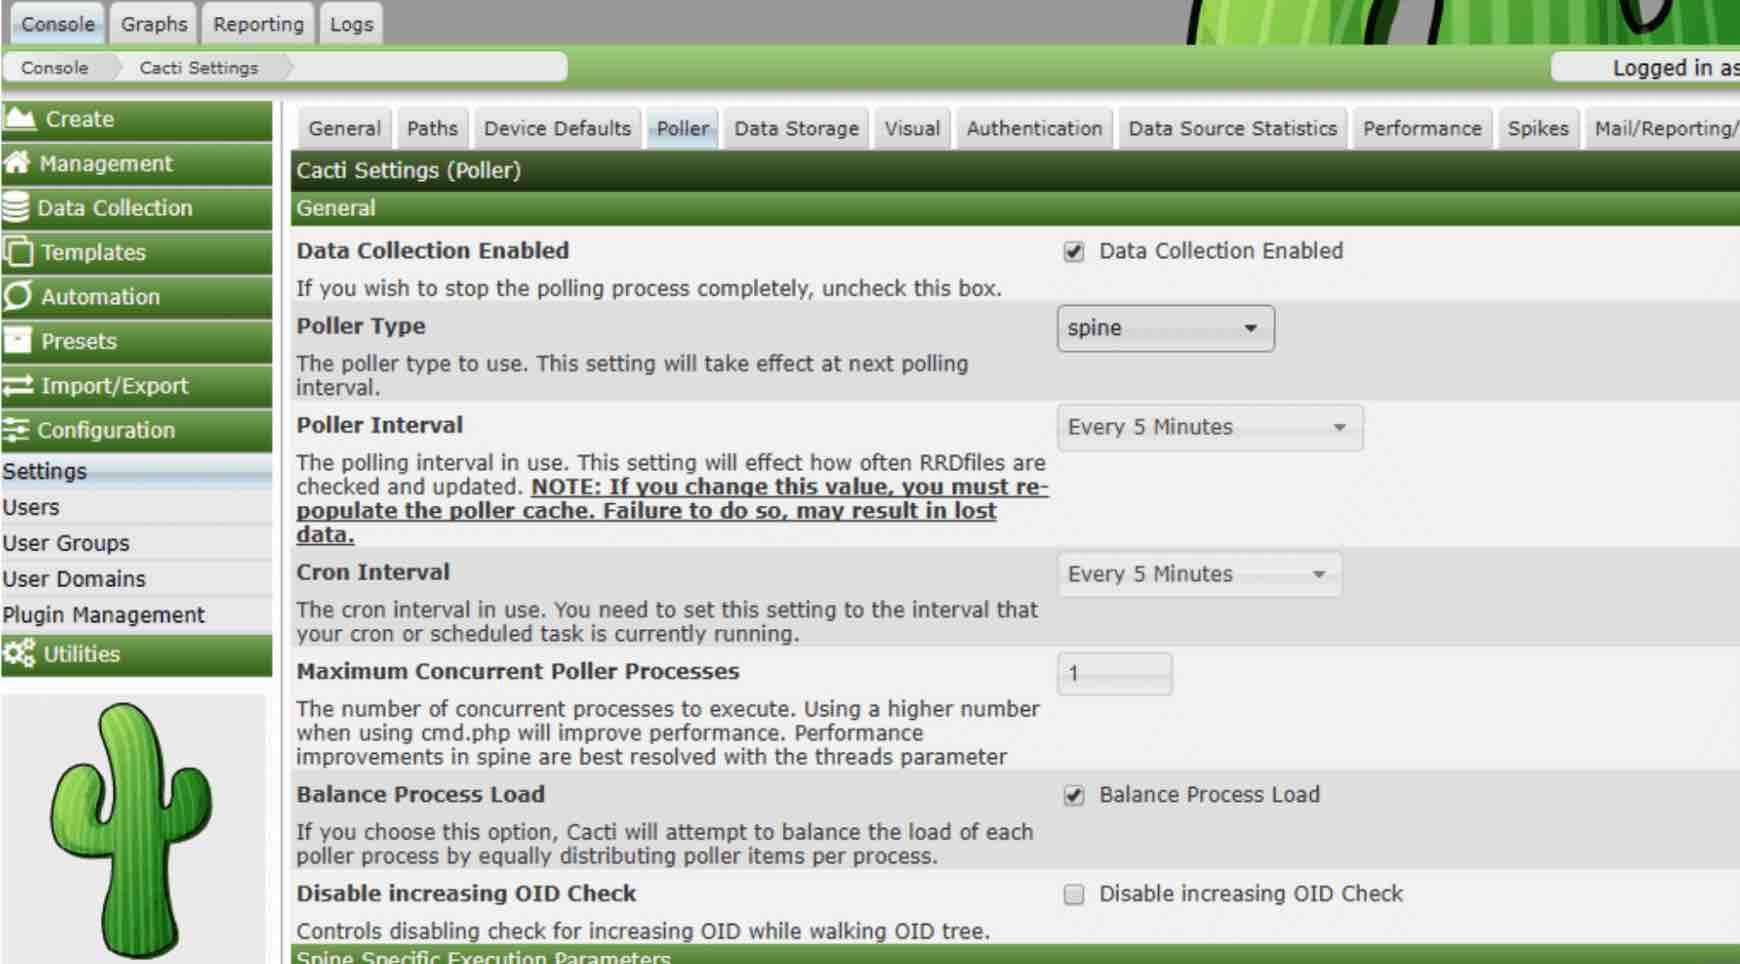
here is an example graph generated by cacti :
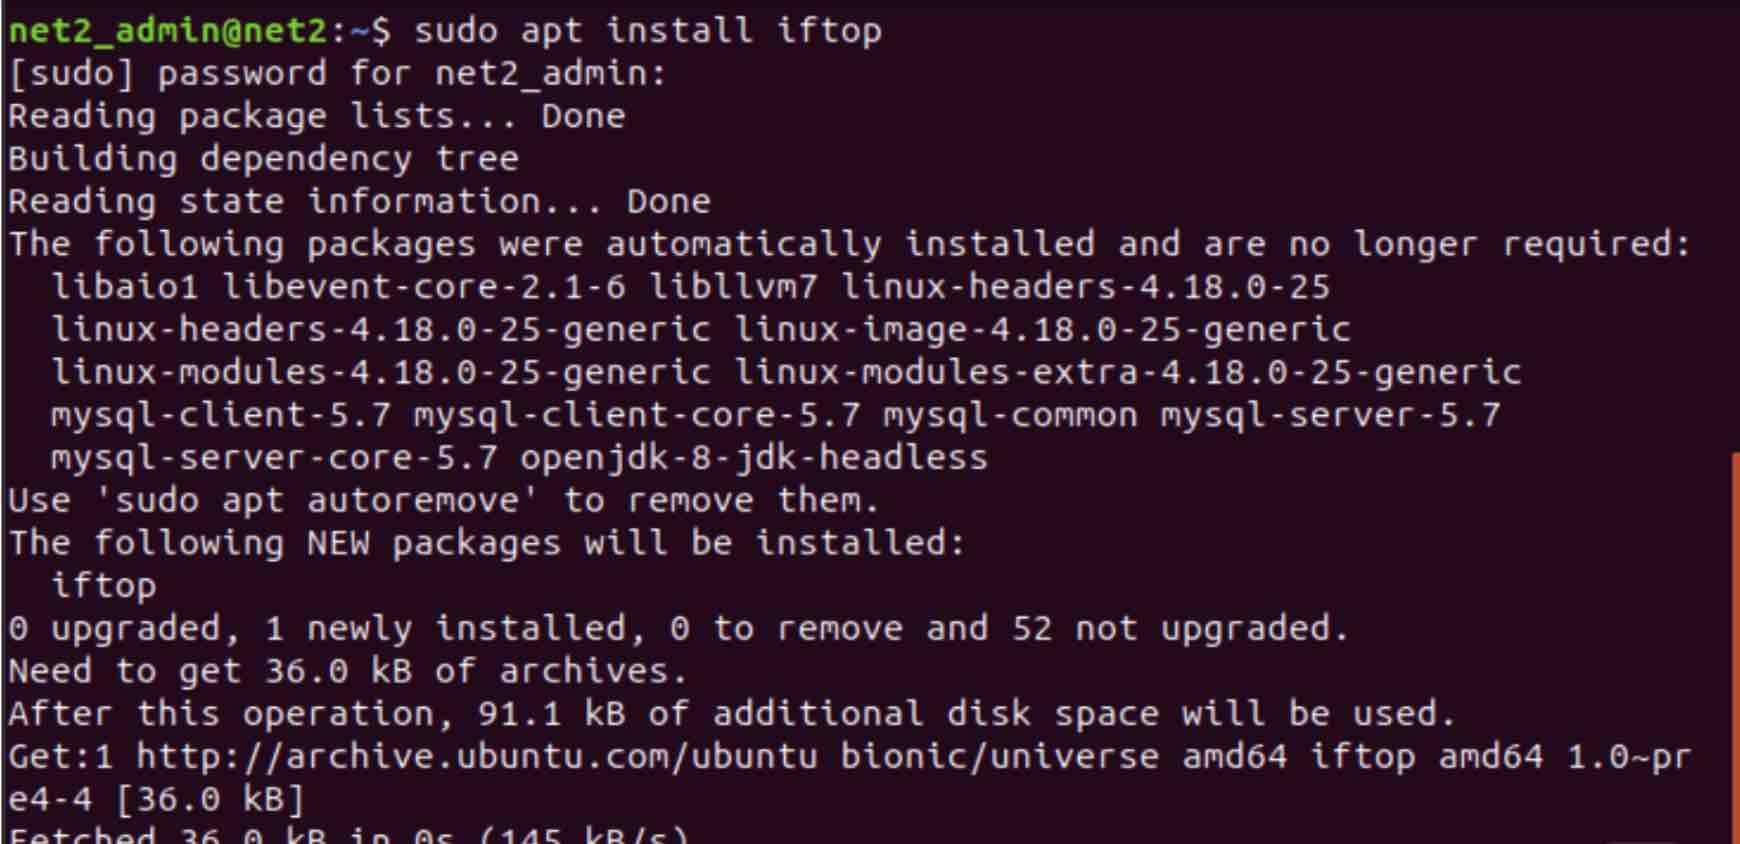
IFTOP
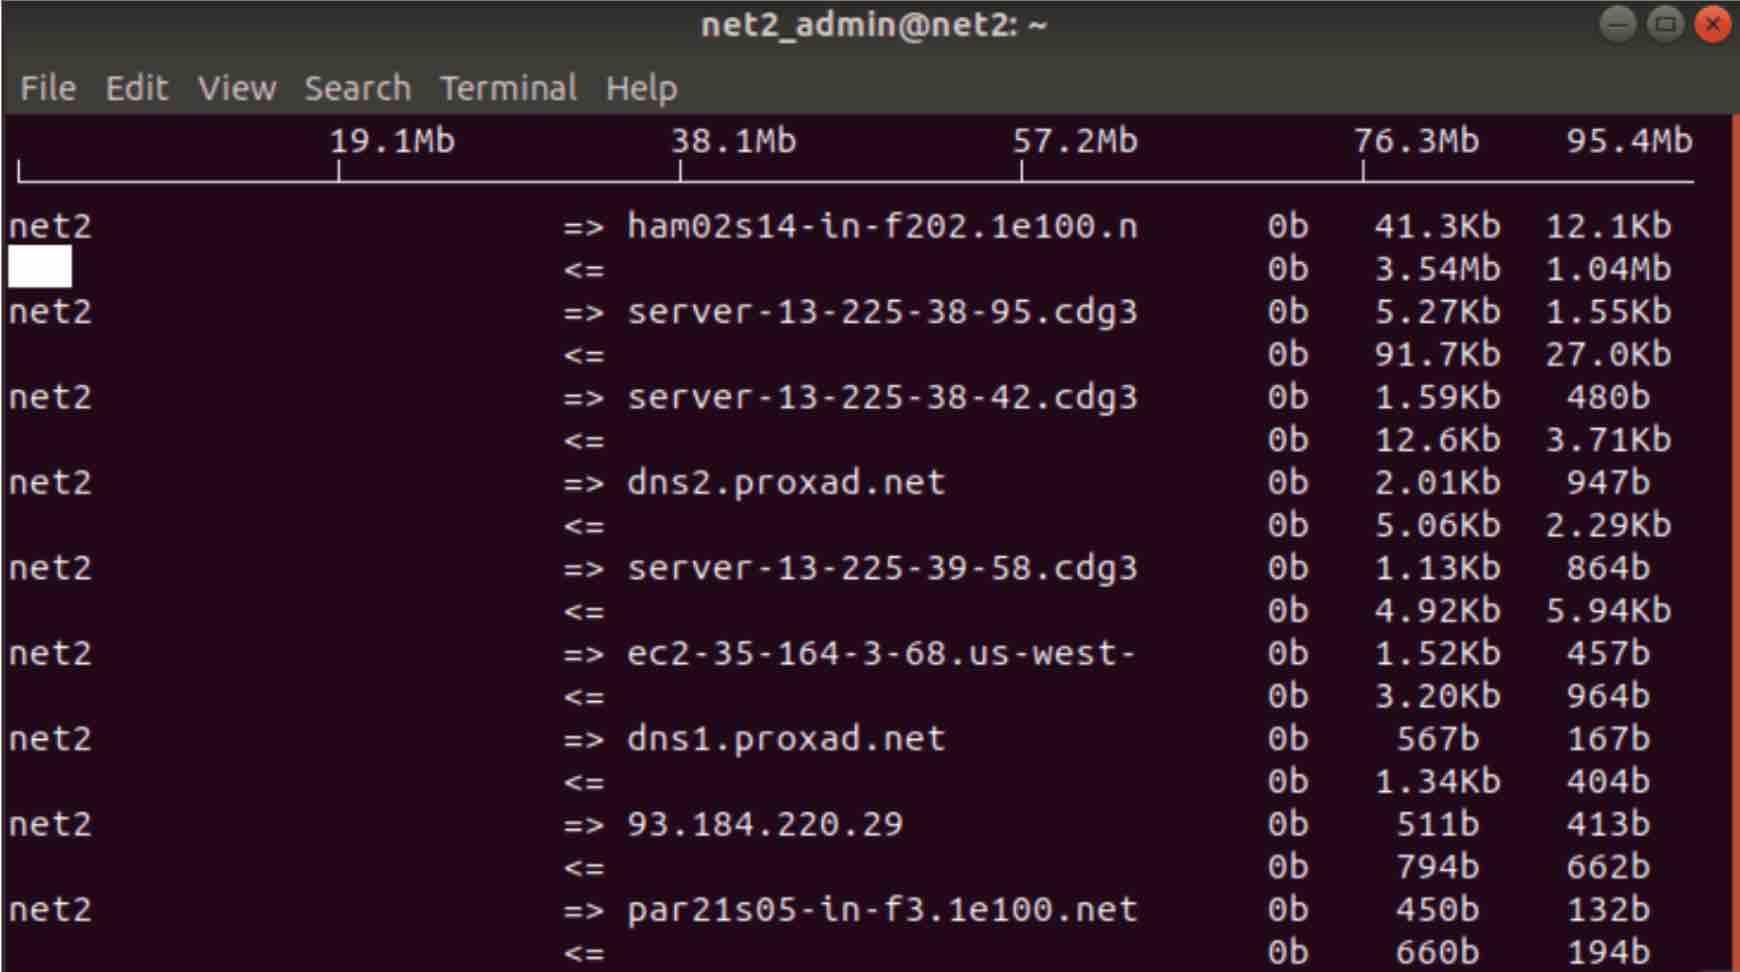
iftop is a command line utility that allows users to monitor and track network connections and bandwidth usage in a graphical interface. It provides information on which network is using the most bandwidth, including details on upload and download usage. Similar to the top command, iftop’s output is constantly updated and sorted by network connections.
By default iftop is not installed by default , you would need to proceed as we did with other packages. Go ahead and install iftop via the command below :
Once it is installed, just type in sudo iftop . This will open up a file as shown below :
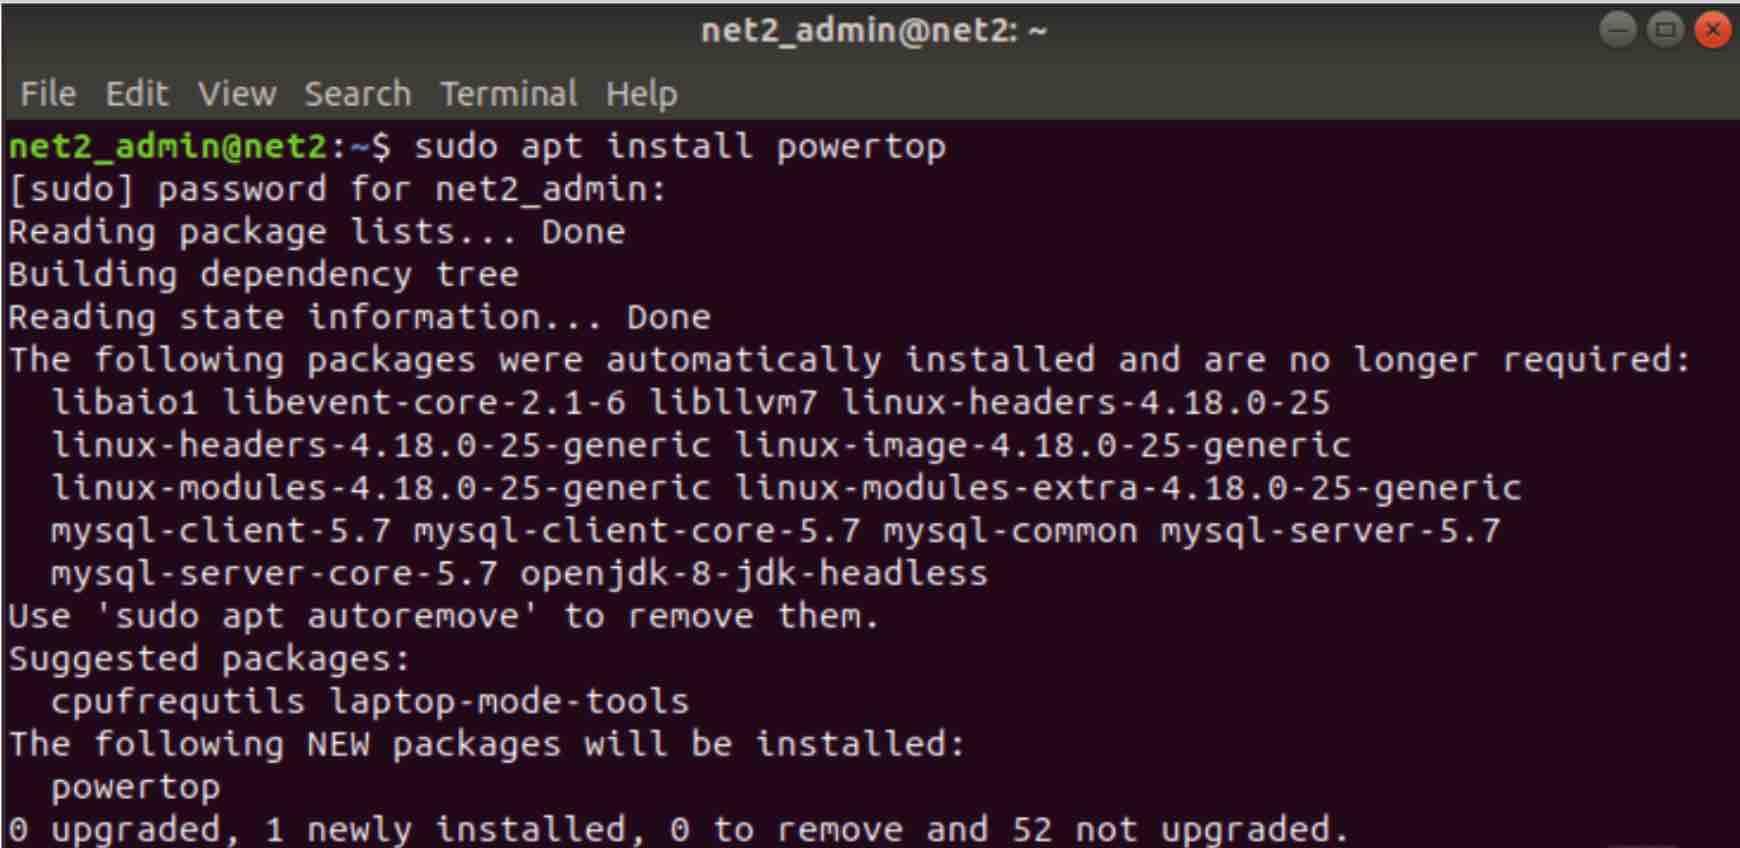
powertop
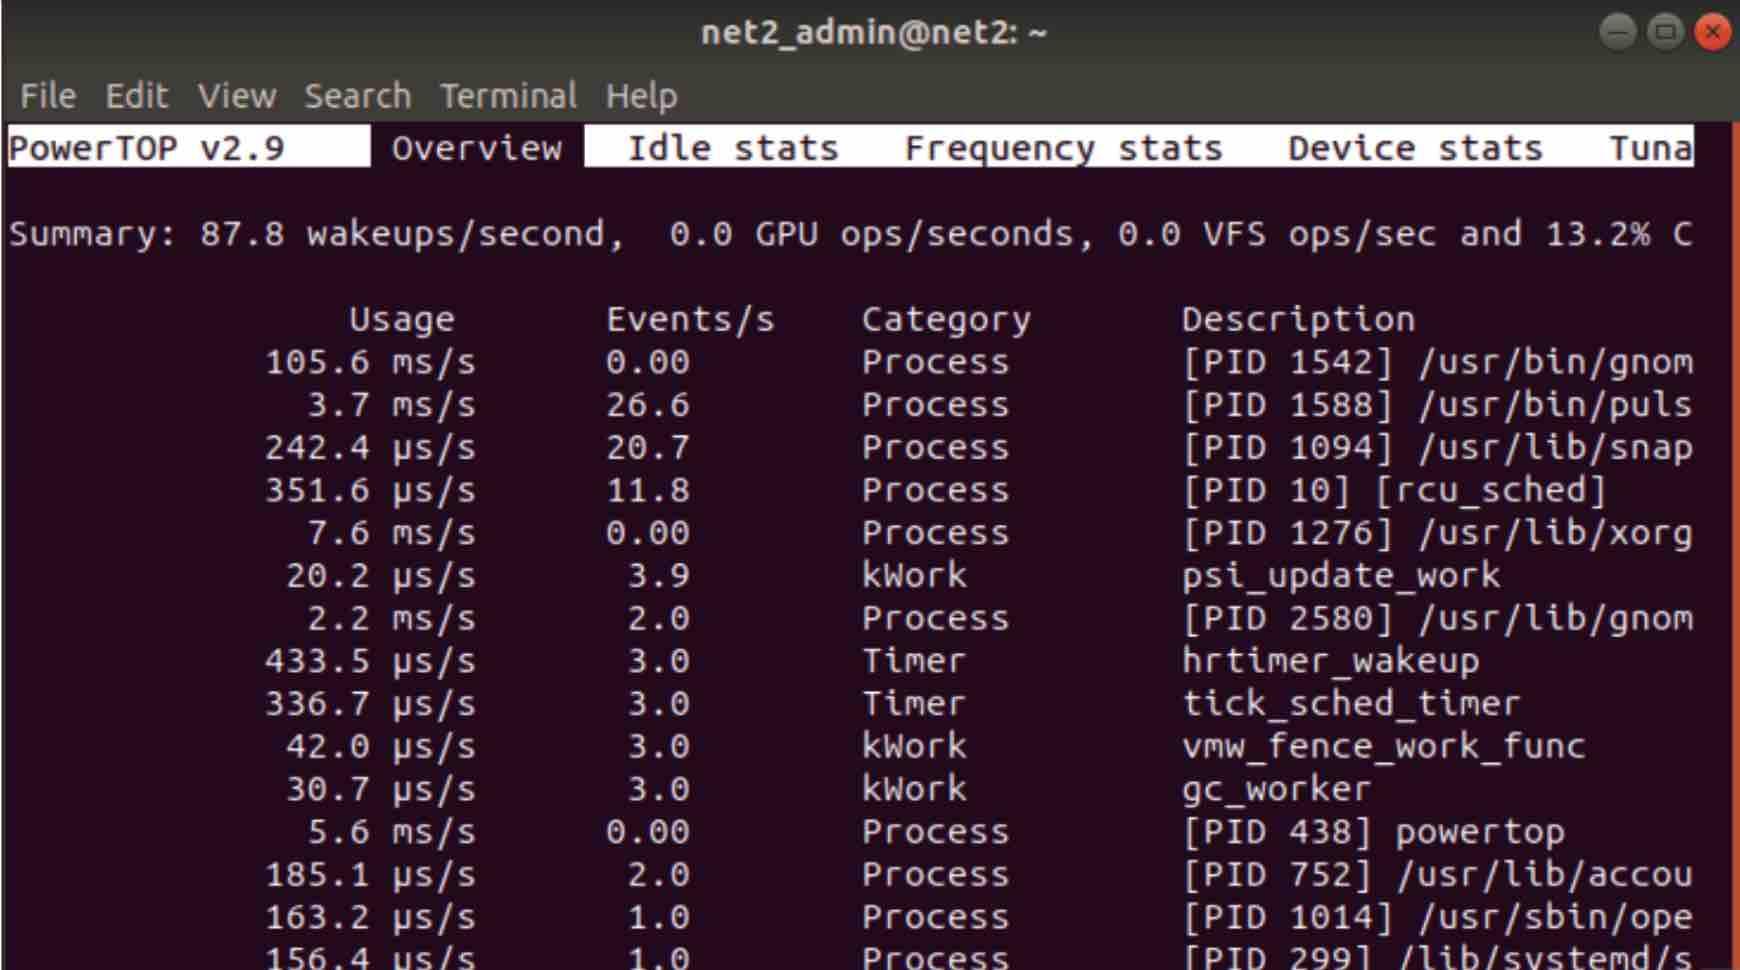
PowerTop is a command-line diagnostic tool that can be used to monitor the electrical power usage of applications running on a Linux machine that is not connected to a power source. By using PowerTop interactively, administrators can configure various power management settings to identify and monitor power-hungry programs. This can be useful for extending the battery life of laptops.
As shown below, you would need to install Powertop tool via the command below :
Once this is done, issue the command powertop :
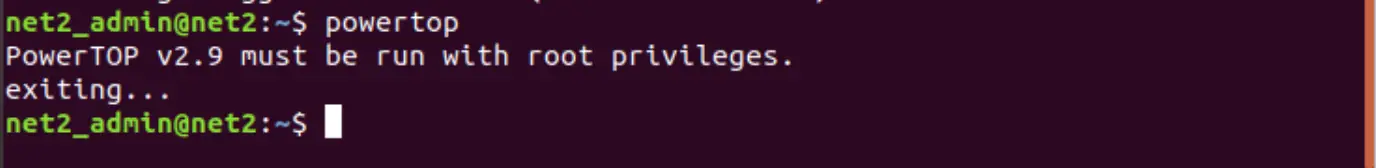
you would need to use sudo to run it :
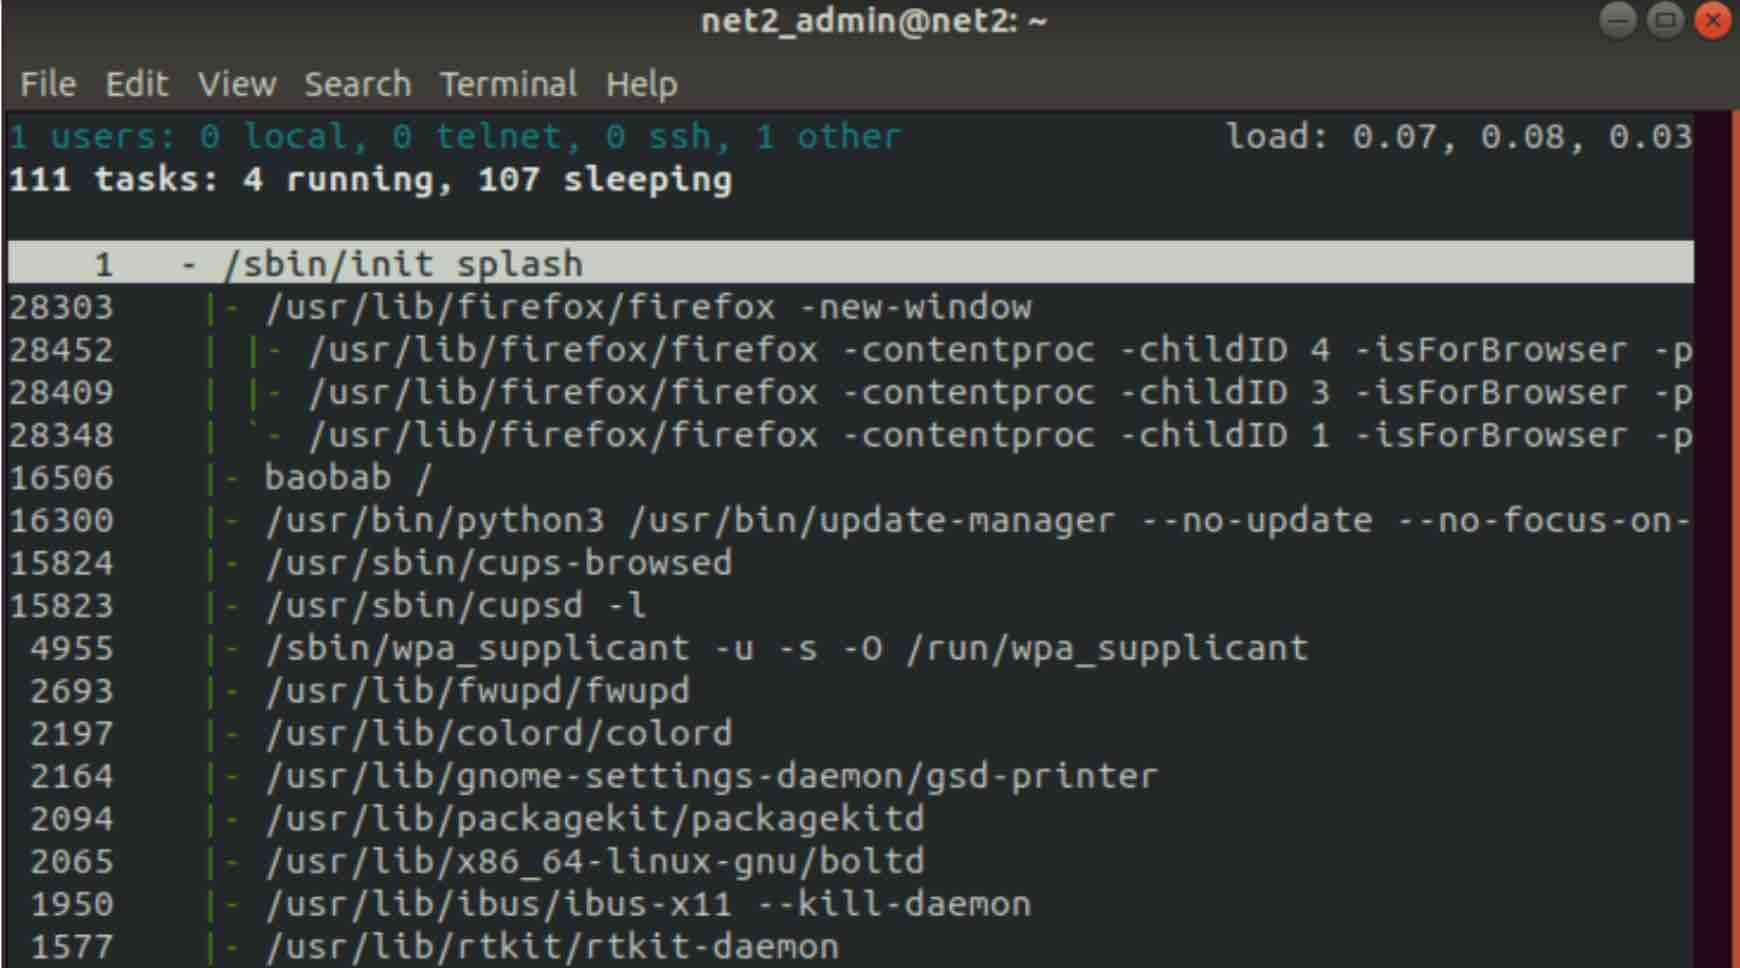
WHOWATCH
Whowatch is a command line tool that allows users to monitor and view information about the logged in users and processes on a Linux system. This user-friendly utility is similar to the “w” command and displays information about the activity of logged in users.
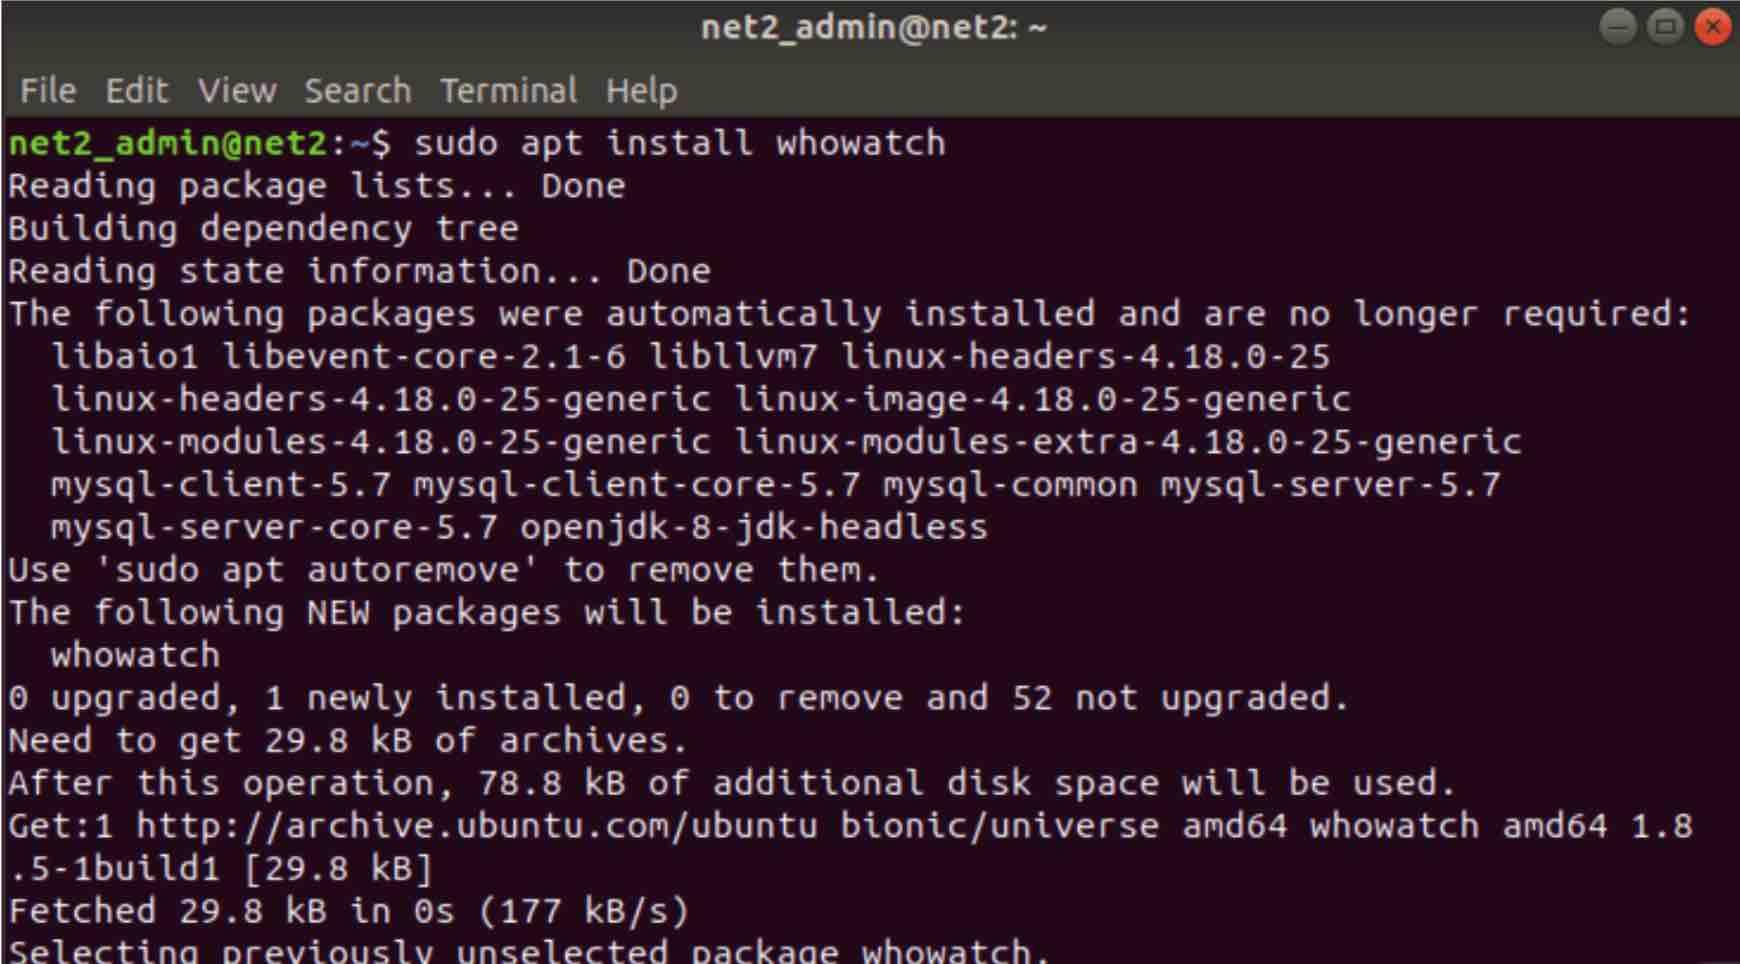
Whowatch is not installed by default, so go ahead and install it :
now you would simply need to issue the command whowatch in order to execute the whowatch application :
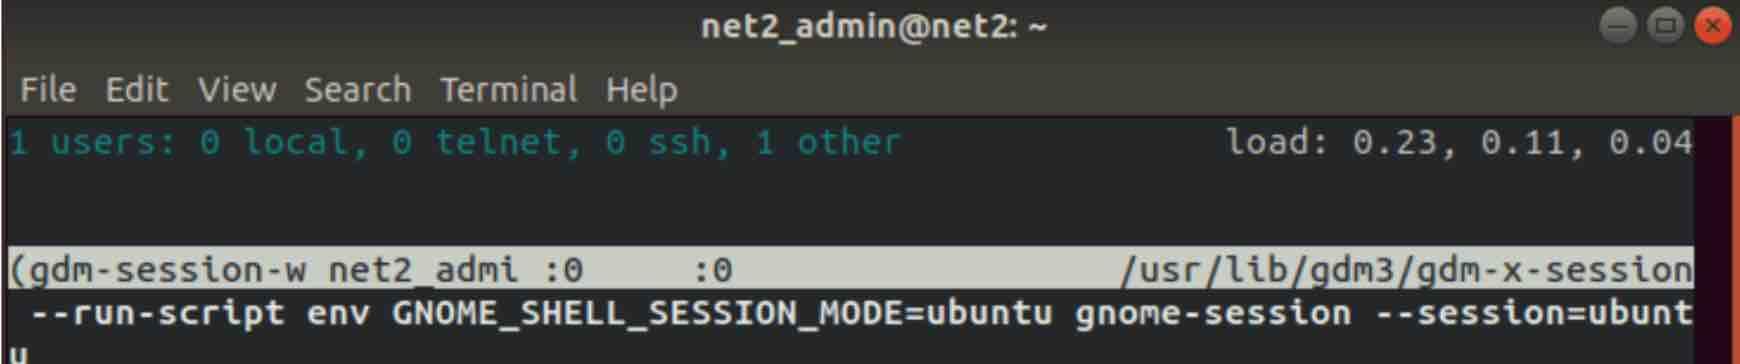
As you can see, it shows the total logged on users as well as the number of users per type of connection (ssh, telnet…).
In order to view all linux user processes, press ‘t’ :
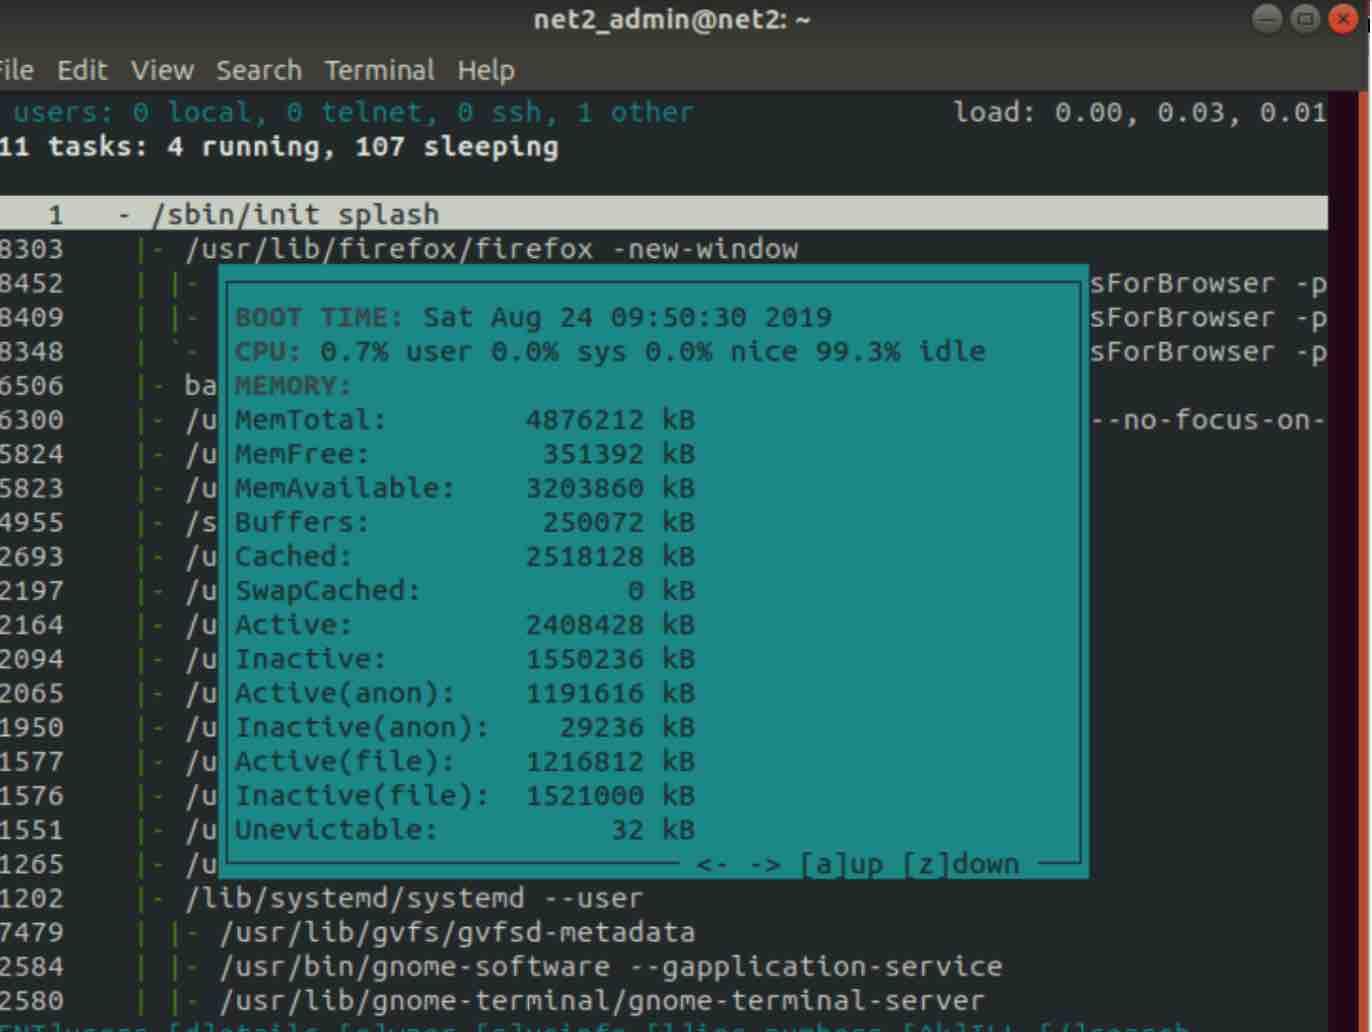
whowatch can also display the system uptime, the users’ login name, host, tty, processes along with the connection type. You also have the possibility to select a specific user in order to view his related processes tree.
In order to view the Linux system information, just type ‘s’ :
Read: Network configuration in Ubuntu
dtrace
DTrace tool is used to troubleshoot problems by showing detailed views of programs and system internals to an unprecedented level. It also provides a language to code event based C-like DTrace scripts.
nethogs
nethogs is a utility used to diagnose network bandwidth traffic in real time. In case there is a sudden network traffic, nethogs will enable you to immediately identify the culprit process.
You can install nethogs via the command :
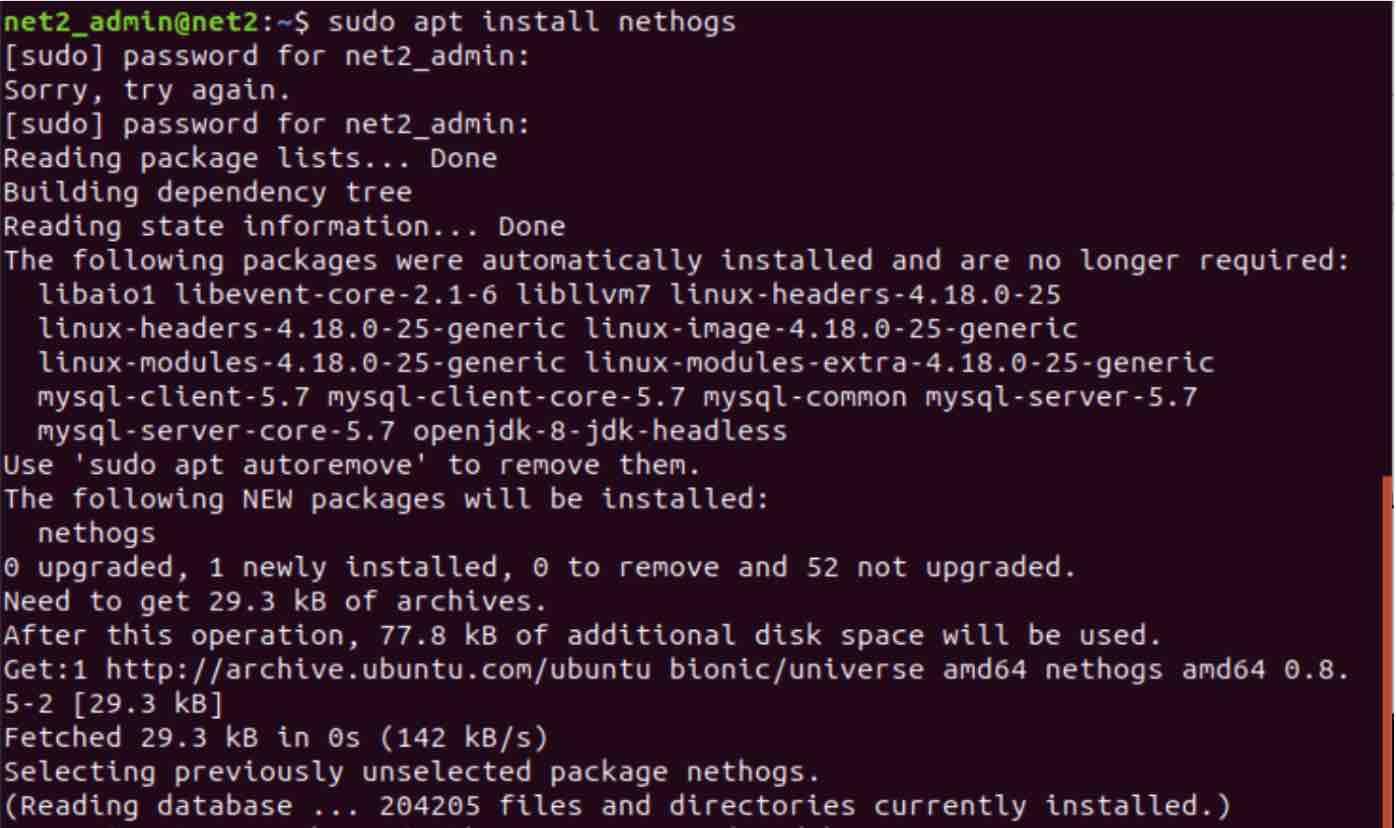
In order to run nethogs, simply issue the command sudo nethogs:
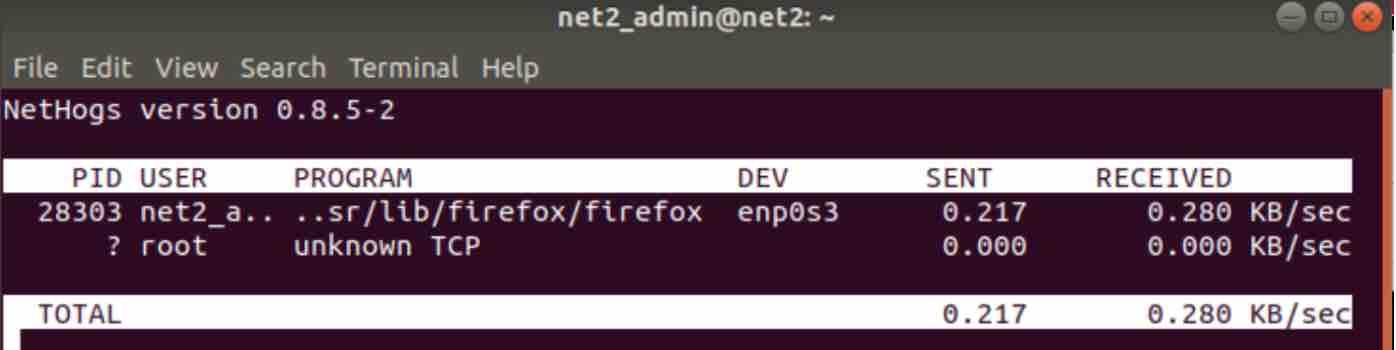
in order to view the options of this command, you can invoke man nethogs.
iotop : Linux disk performance monitoring tool
Similar to top command, iotop is an open source utility used to monitor disk i/o usage and outputs current i/o utilization by threads or processes. System administrators will find it useful to identify processes with unusual disk i/o read/writes.
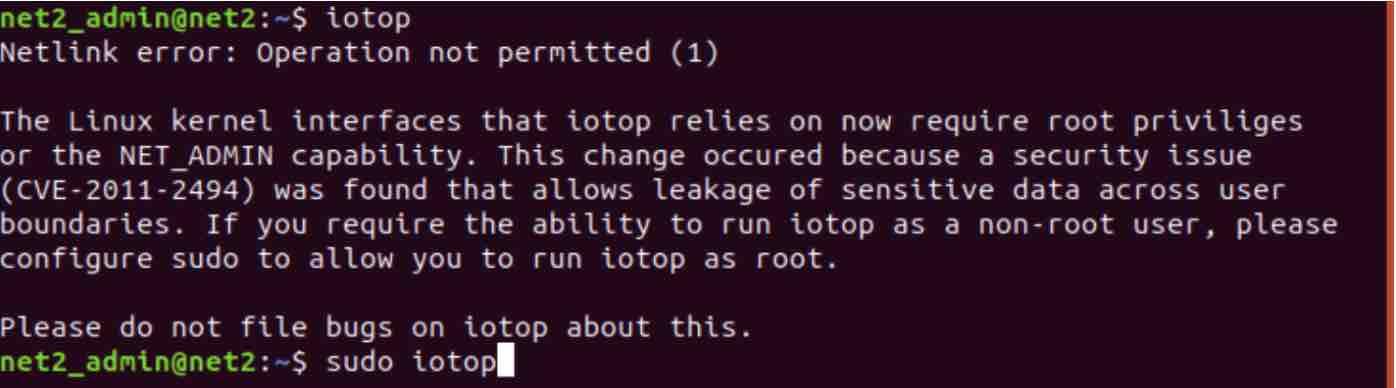
iotop is not installed by default , so you would need to proceed as follows :
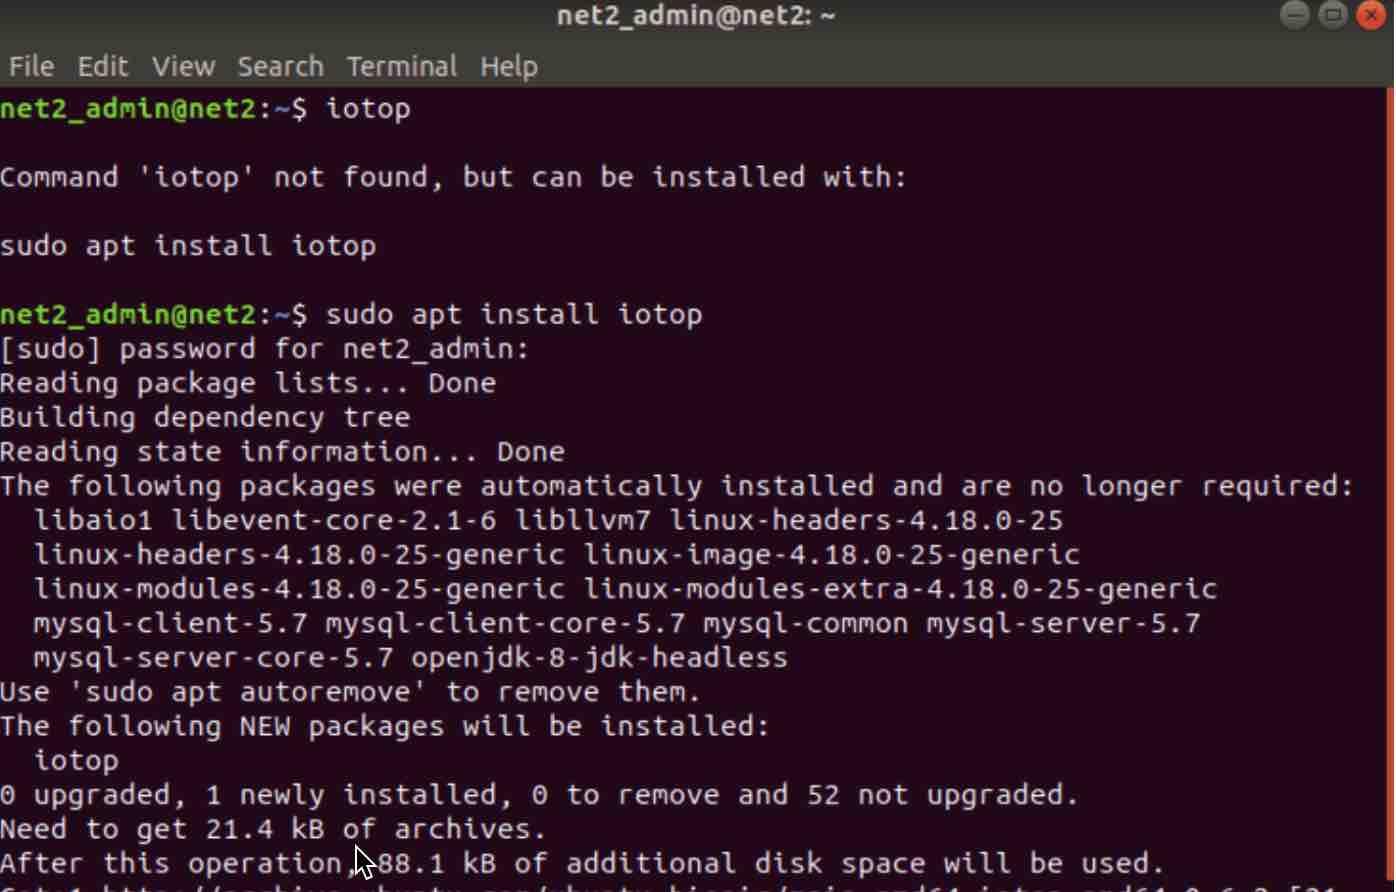
once this is completed, issue the command sudo iotop :
This will display the output below :
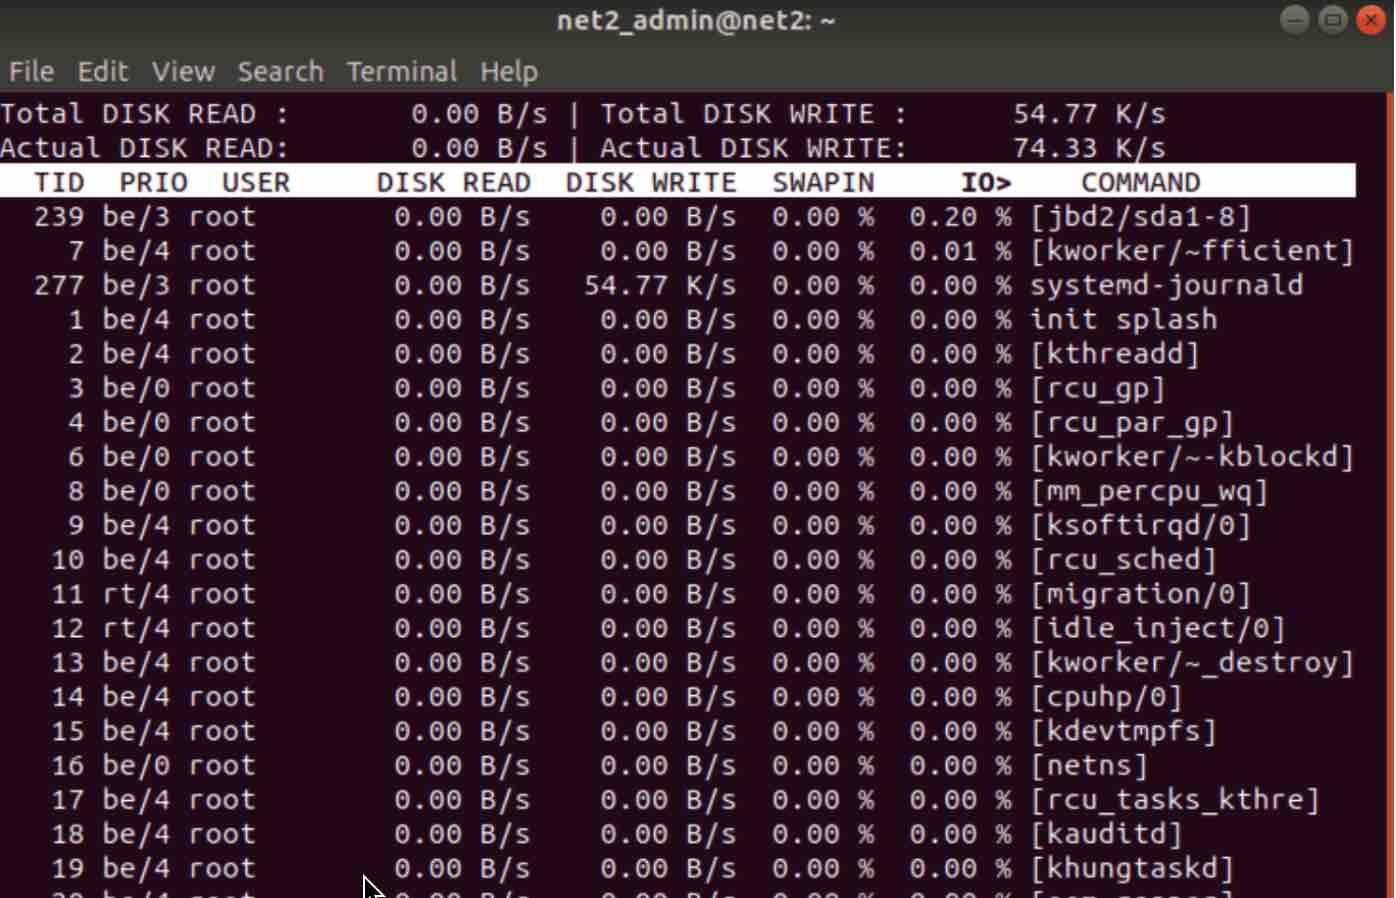
If you want to see only current processes or threads with I/O activities. you should use iotop with -o or –only option..
The “IO>” column above, shows total I/O operations including disk and swap usage for each process.
The SWAPIN column provides swap usage details for each process
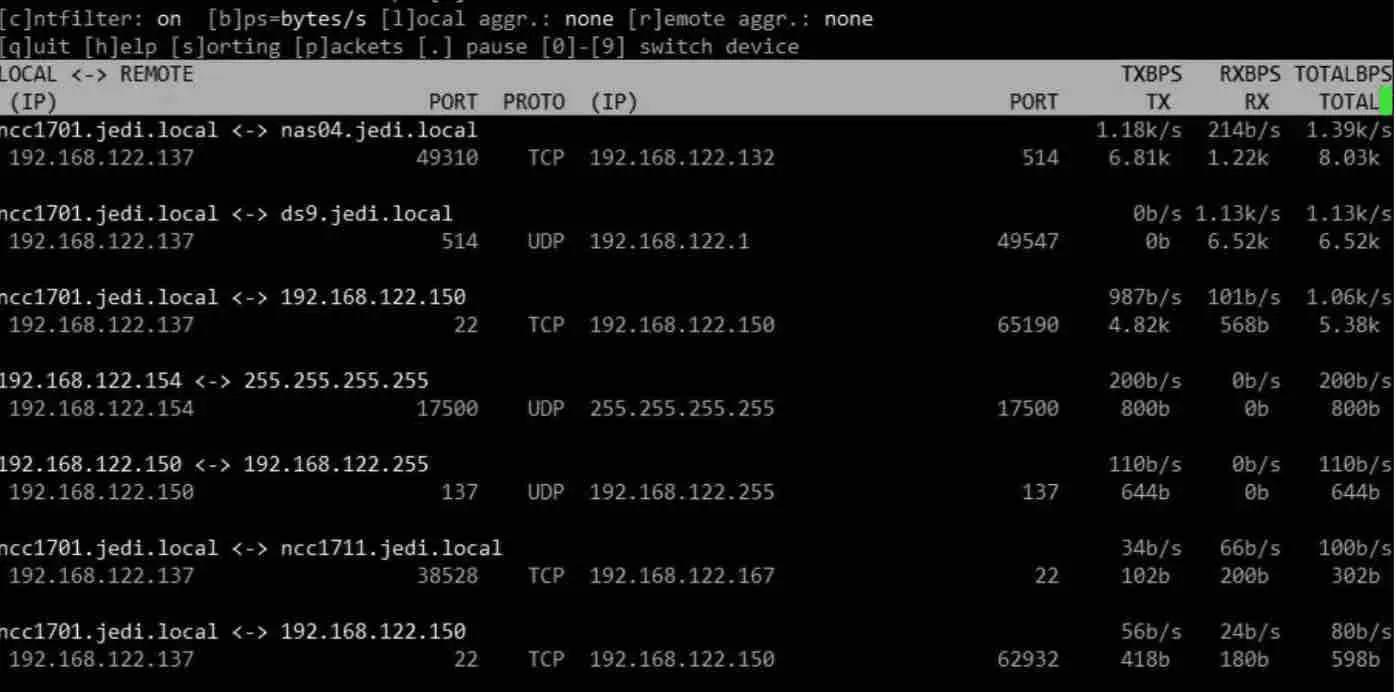
jnettop
If you want to know the network statistics and the bandwidth consumed then jnettop is your friend. If you prefer a graphical frontend, then you may want to try jnettop-gui which is a Java based interface for jnettop. System administrators will find it useful to quickly monitor the state of the network.
here is a sample output of jnettop :
lttng
LTTng is a powerful tracing utility designed to help developers identify and troubleshoot hard-to-debug issues on production systems. It is a low-overhead tool that does not disrupt the system being traced, making it ideal for use in a variety of settings. LTTng can be installed on major Linux distros using a package manager and is controlled through a command-line interface. It allows users to create and configure multiple tracing sessions, as well as record multiple traces at the same time with a range of configuration options.
net-snmpd
Net-SNMP is a set of libraries and utilities that are required to use and deploy the SNMP (Simple Network Management Protocol ) protocol which is used for monitoring network-connected devices, such as switches, routers, servers, .. .
It contains perl and python modules, command line applications, a generic client library, an SNMP agent…
pcp
pcp or Performance Co-Pilot is an open source application infrastructure used for visualizing, monitoring, recording, diagnosing and controlling the activity, status and performance of computers, networks, servers and applications.
Wireshark
wireshark is a free and open source utility that monitors and troubleshoots network connections. It can also analyze network packets including dropped packets and can help identify malicious activity on the network. Use wireshark to monitor network traffic.
As usual you will need to install it via the command below :
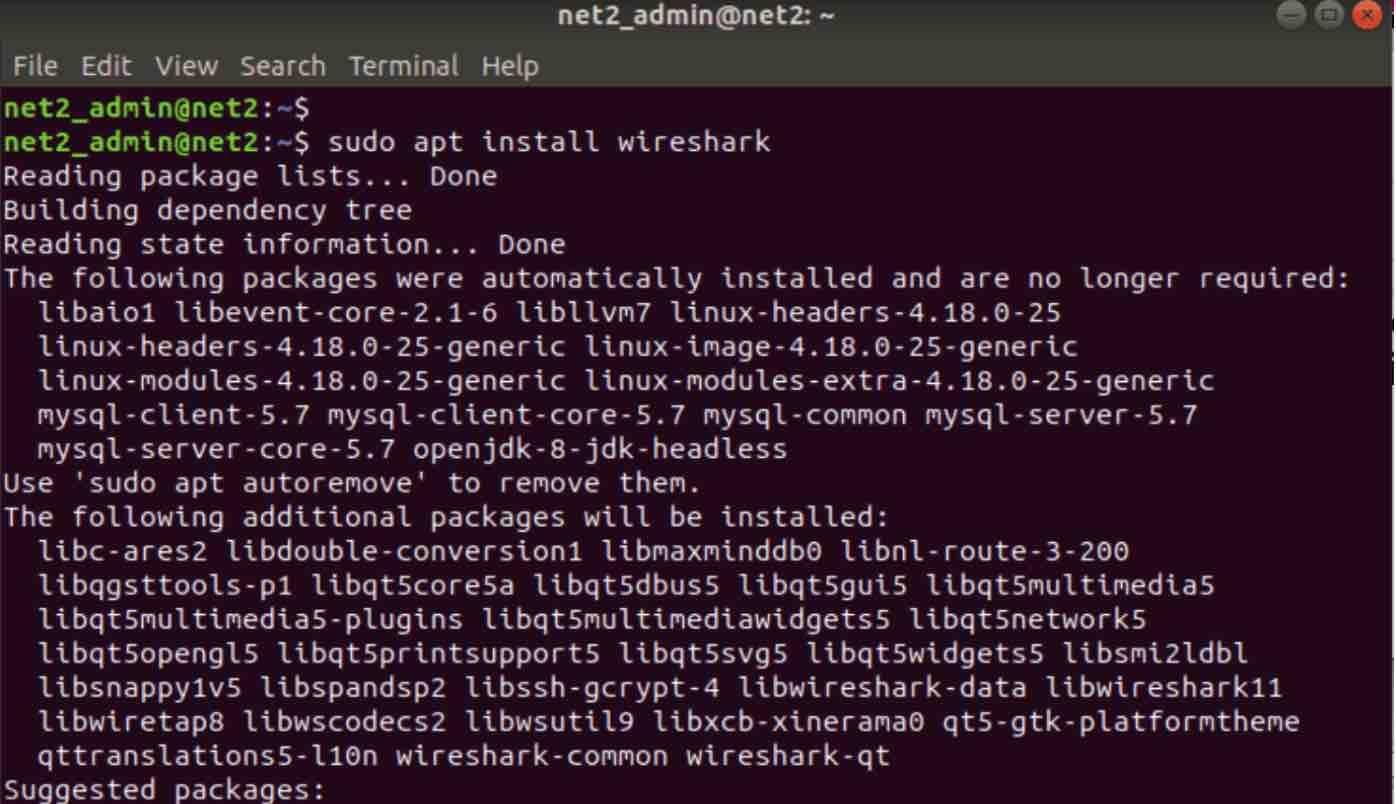
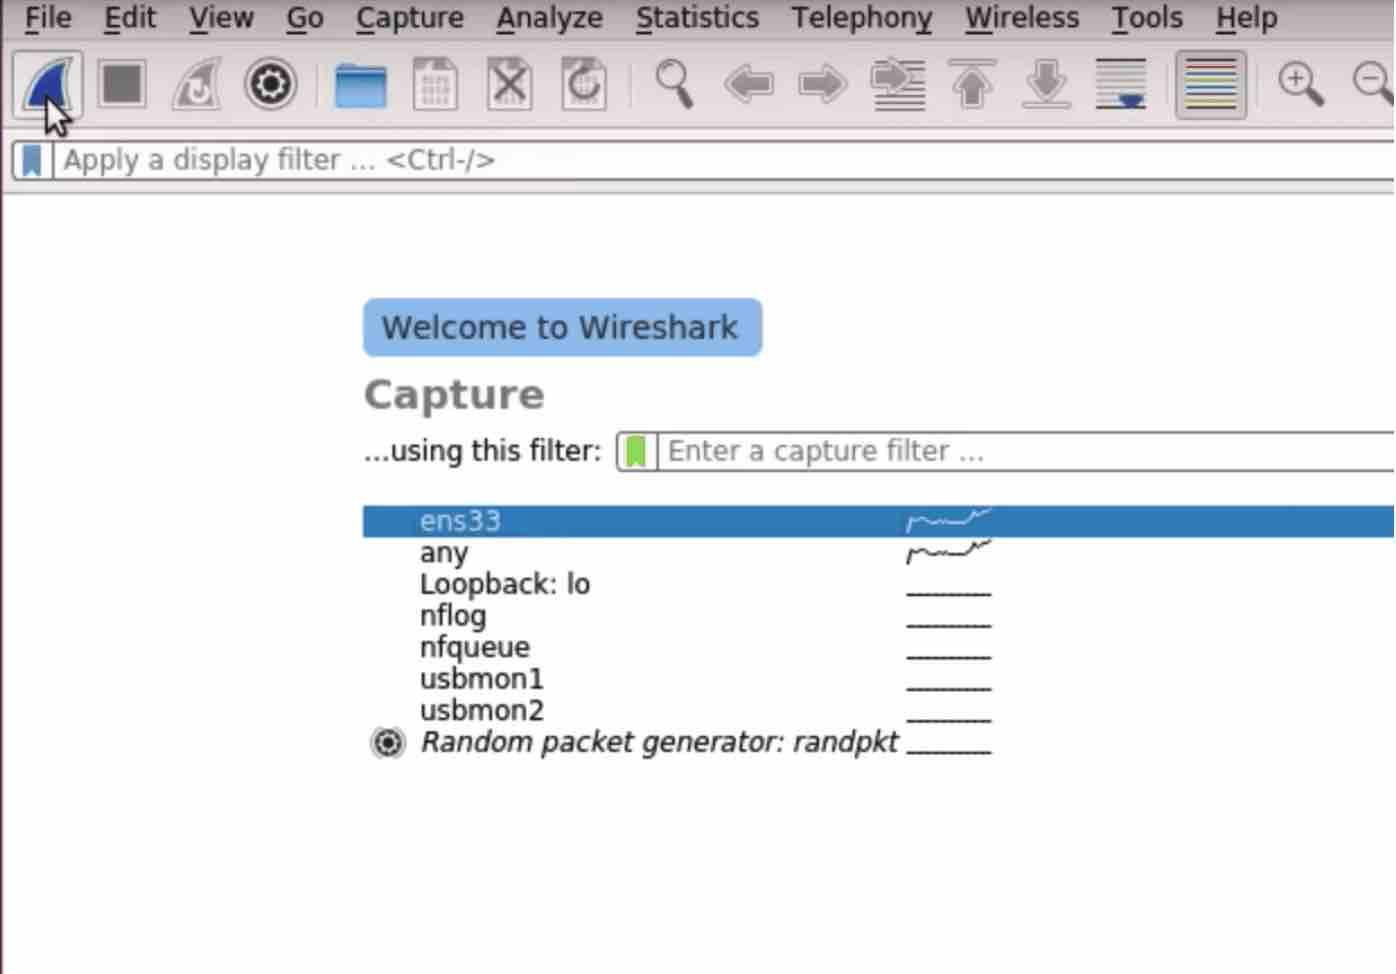
Once installed, just call wireshark in the terminal. this will open up the window below :

You can for instance select an entity as shown above and click on Start toolbar button (shark fin shaped button). This will display the window below :
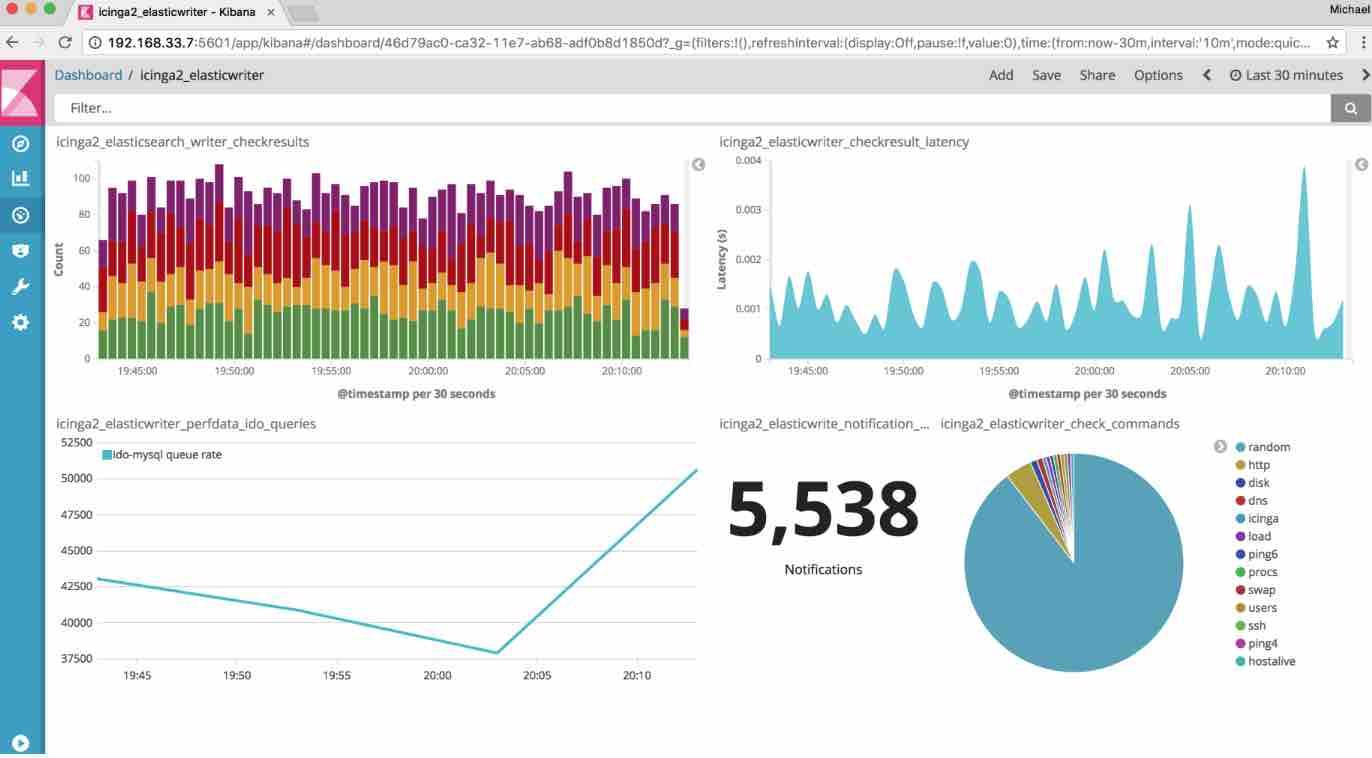
Icinga 2
The open-source monitoring tool, Icinga, is designed to monitor entire data centers and can be used to monitor a single server or multiple servers from a single monitoring system. Icinga2 is capable of checking the availability of resources such as system updates, networks, and services. System administrators can be alerted in case of serious issues such as power outages or or network failures.
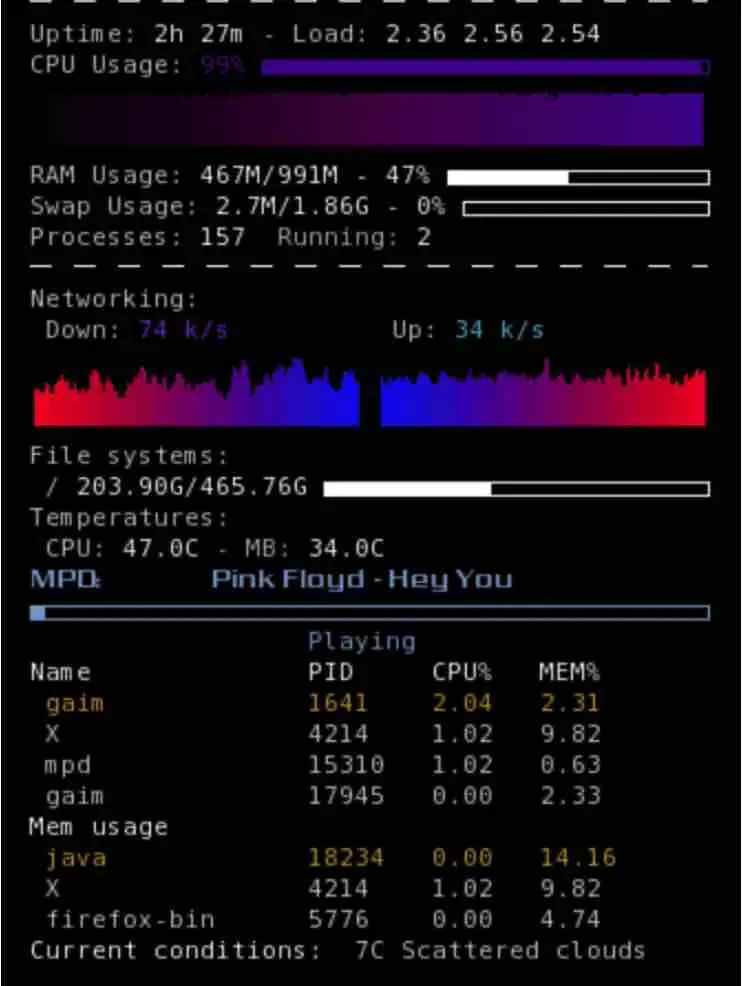
Conky
Conky is a free lightweight network monitoring application. It provides detailed information about your disk usage, CPU,RAM utilization, network devices, connections and processes.
Conky can be installed via the following commands in Ubuntu (starting from 14.04):
sudo add-apt-repository ppa:teejee2008/ppa
sudo apt-get update
sudo apt-get install conky-manager
here is a sample output :
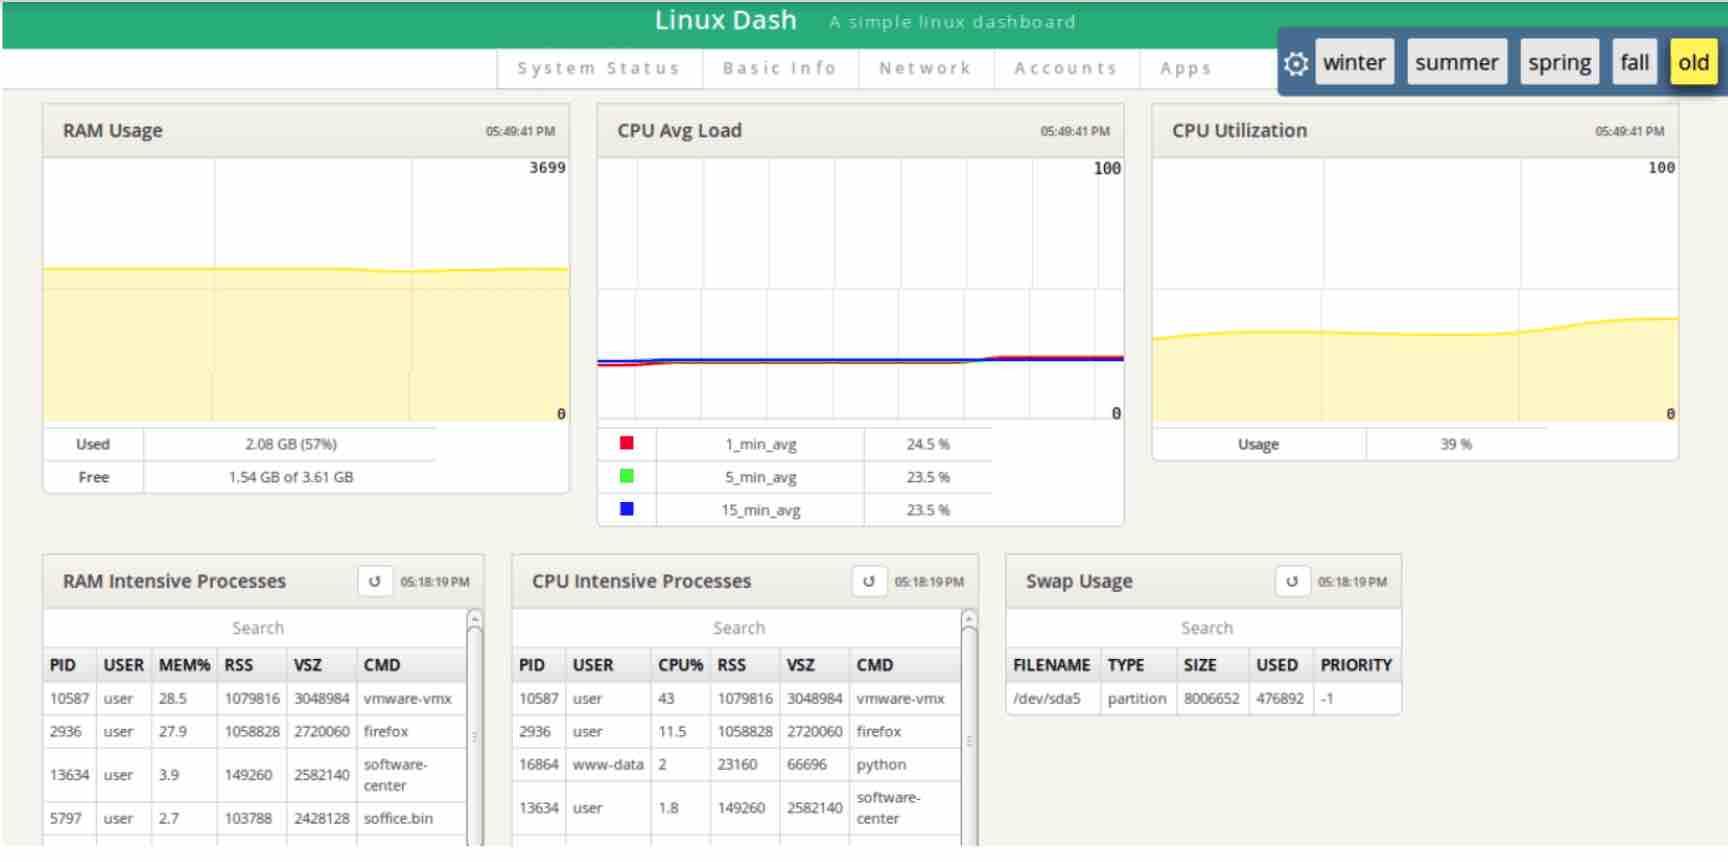
Linux Dash
“Linux Dash” is an open source, lightweight web based interface that displays detailed information about your Linux system such as CPU, RAM, running processes,file-system, users, monitor device bandwidth usage in real time.
Since it is based on php, you would first need to install php package . Apache2 server would need to be installed as well . Issue the commands below :
# apt-get install apache2 apache2-utils
# apt-get install php5 curl php5-curl php5-json
# service apache2 start
Then you would have to download the package from github using the command :
git clone https://github.com/afaqurk/linux-dash.git
Finally, start your apache server.
here is a sample output :
Read: How to install Apache web server on Ubuntu
Observium
Observium is yet another network monitoring utility which helps manage your server network which supports a wide range of operating systems, platforms and device types. For more informaion, visit the page https://www.observium.org/ .
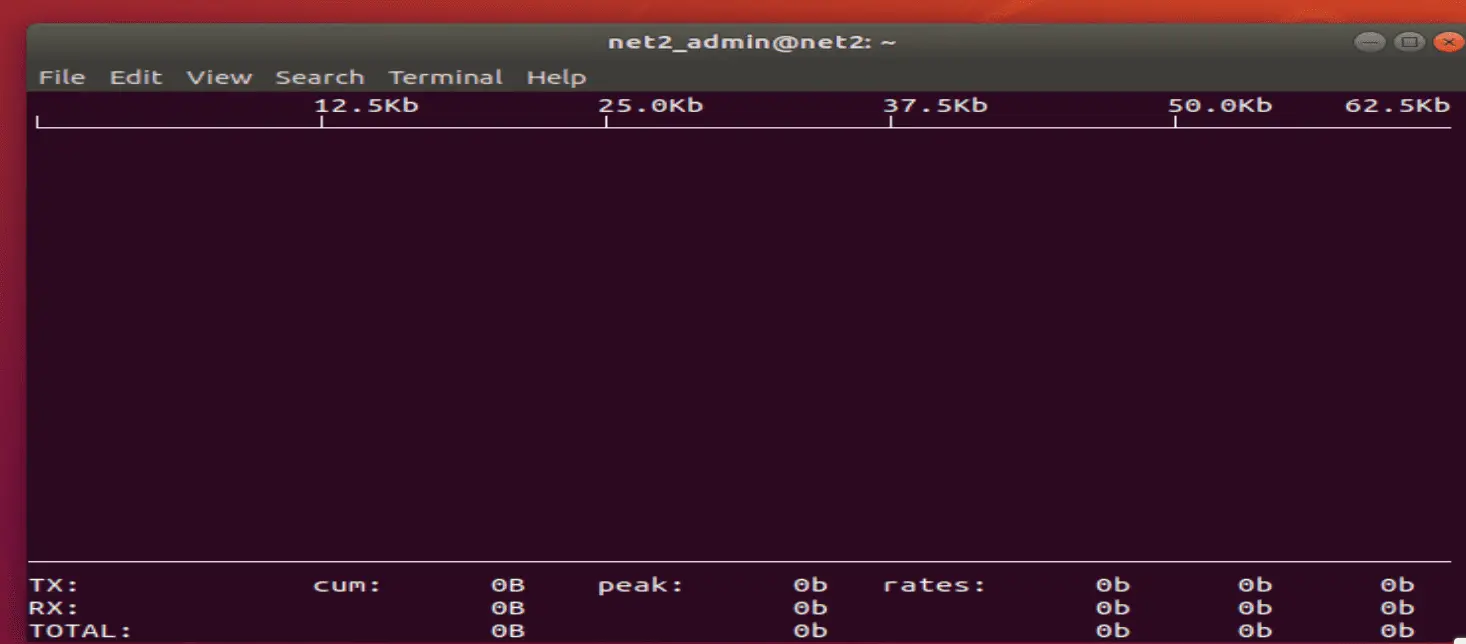
IFtop
Iftop is another command-line based utility which shows bandwidth usage only. This tool helps to get information about network speeds. It is one the most used network bandwidth monitoring tools.
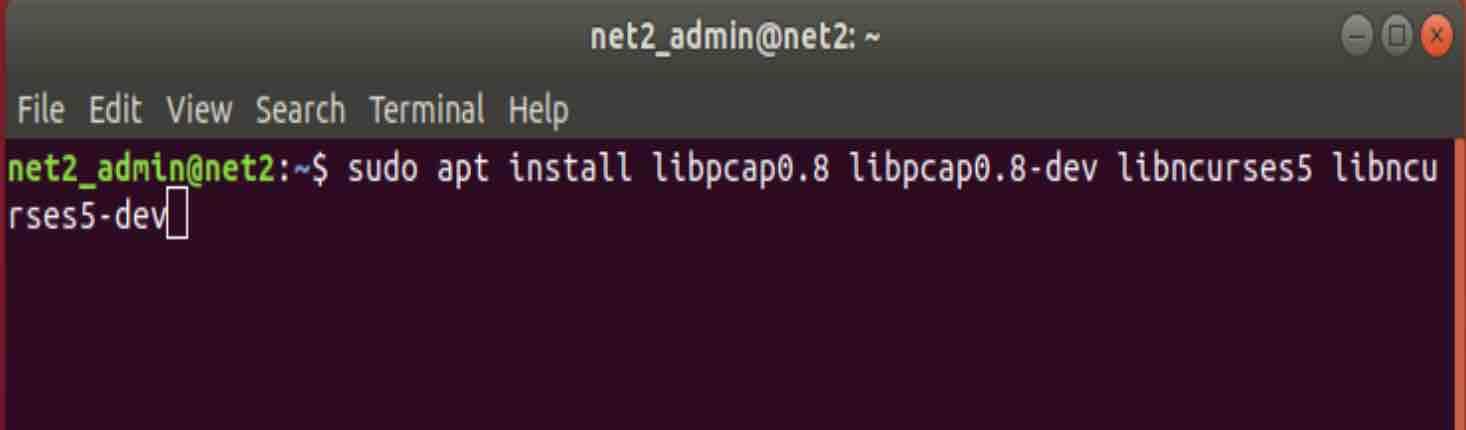
Like the htop, you will need to download and install iftop first. To install iftop, you will be required to install libpcap and libncurses. Type in the following command in the terminal.
sudo apt install libpcap0.8 libpcap0.8-dev libncurses5 libncurses5-dev
Then,
sudo apt install iftop
then
iftop
Netstat
Netstat is a command-line utility that allows you to monitor incoming and outgoing network packets. It provides information about the local address, foreign address, data sent and received, and other network parameters. There are many commands available for Netstat, some of which include:
Netstat –a
This command is used to see all the TCP and UDP connection ports. You can also use –at flag to see TCP port connection only and –au flag to see UDP port connection only.
Netstat -l
This command is used to see all the listening connections available in the machine.
Netstat –st
To show all the TCP protocols.
Netstat –su
To show all the UDP protocols.
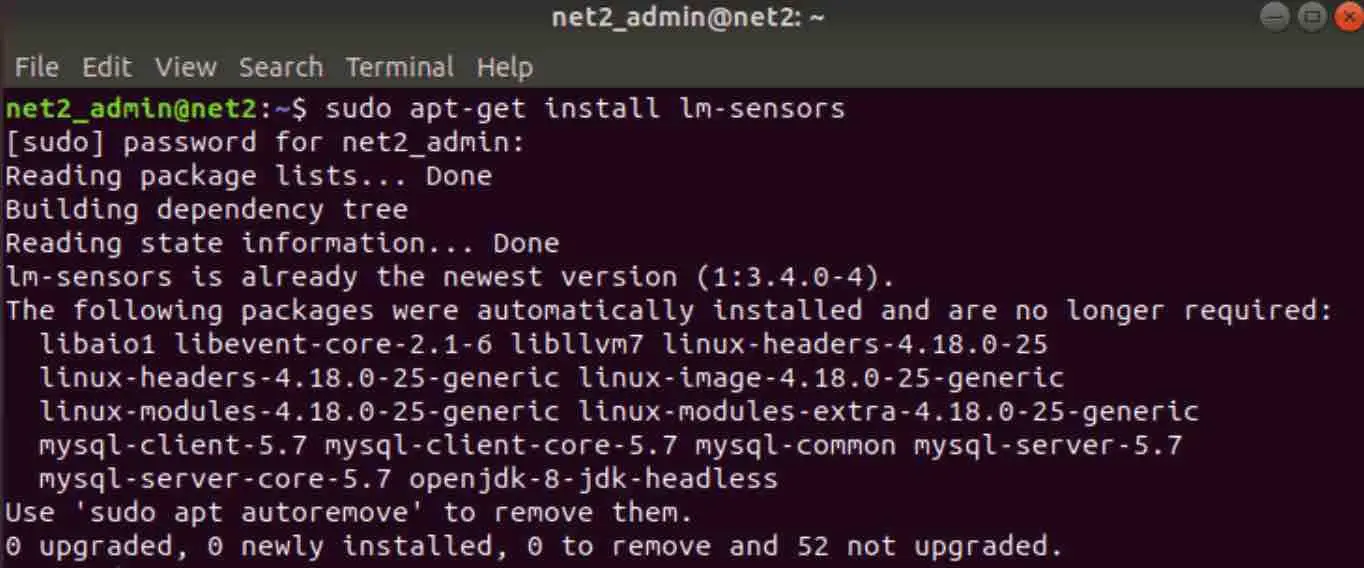
Lm-sensors
Lm-sensors is a powerful utility for monitoring temperature in your Ubuntu Machine. This utility is used for checking CPU temperatures. To install and run Lm-sensors use the following commands.
sudo apt-get install lm-sensors
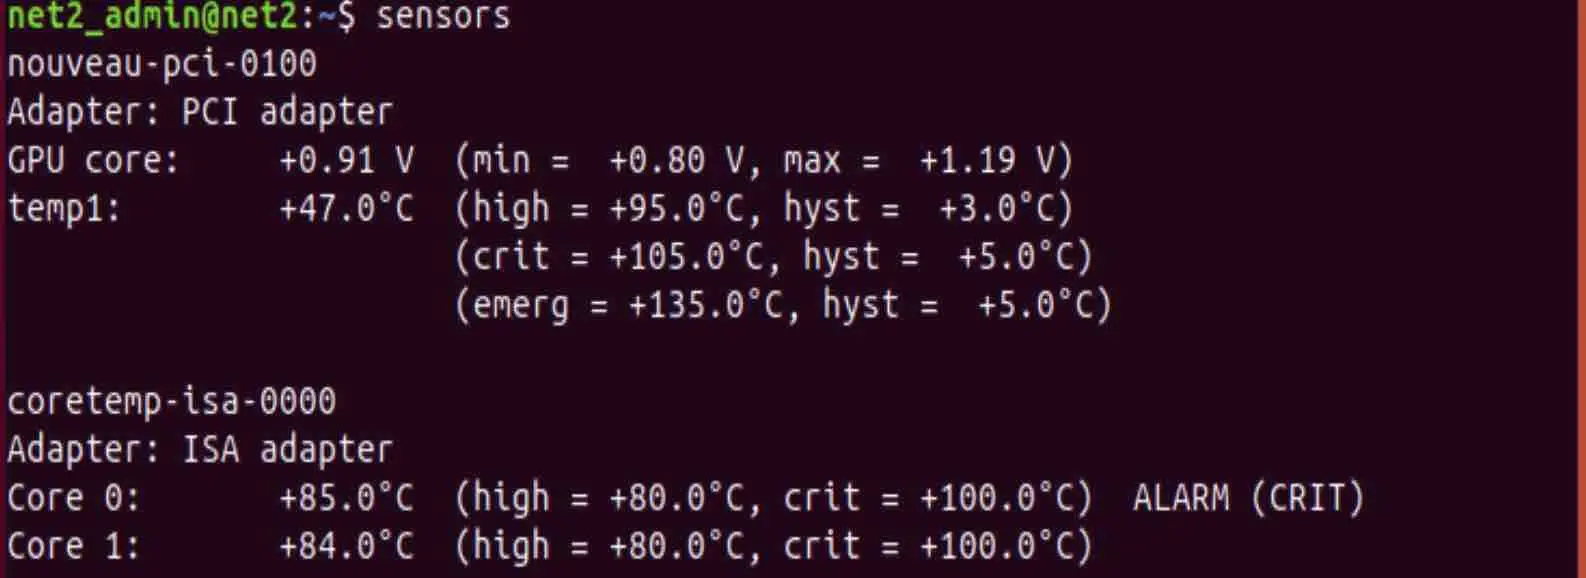
Finally, issue the command below in order to display the CPU temperature.
sensors
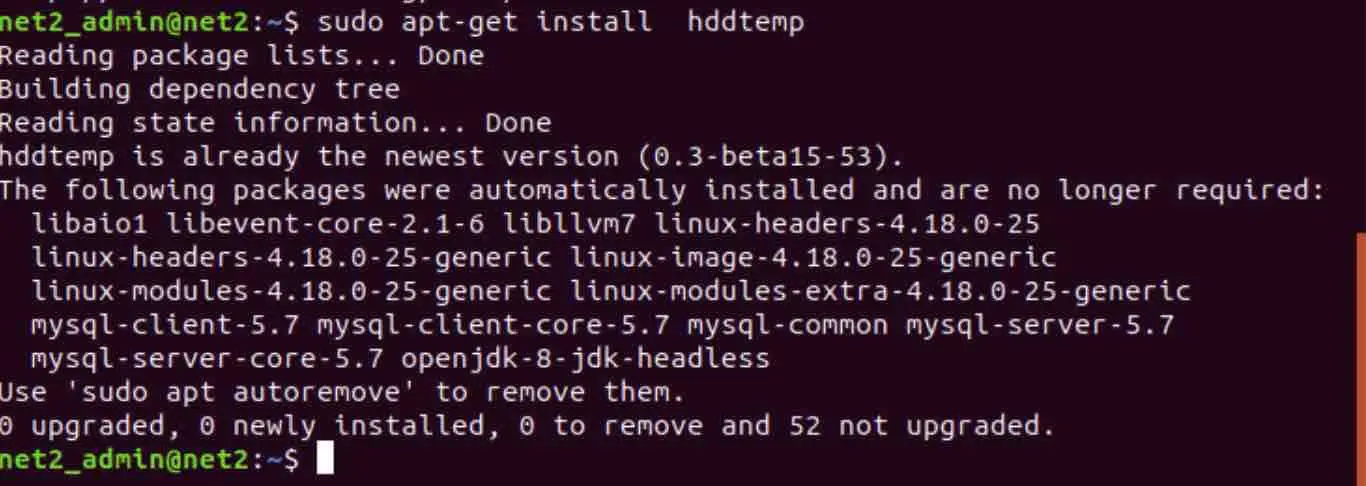
Hddtemp
Hddtemp is used for monitoring HDD temperature. To get hddtemp, type in the following command :
sudo apt-get install hddtemp
Then type in :
hddtemp your_hard_drive_name
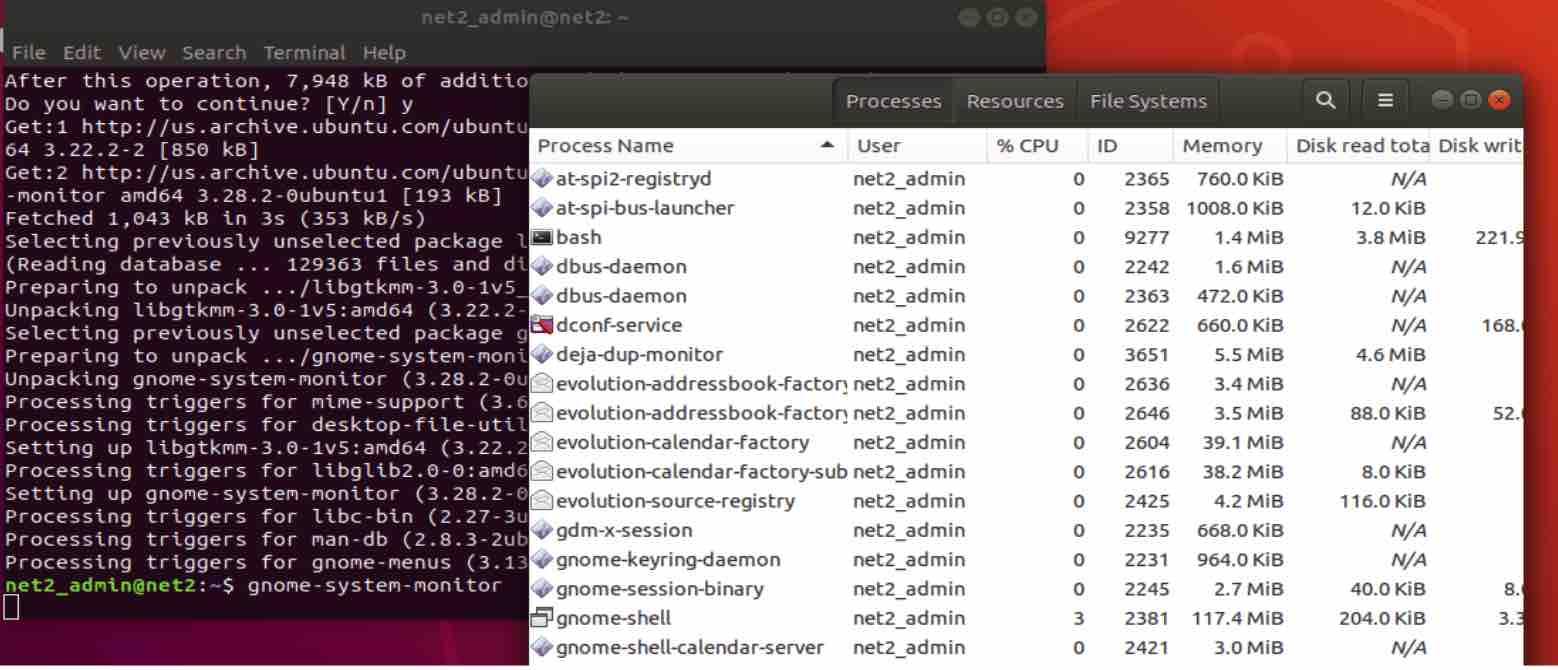
GNOME system monitor
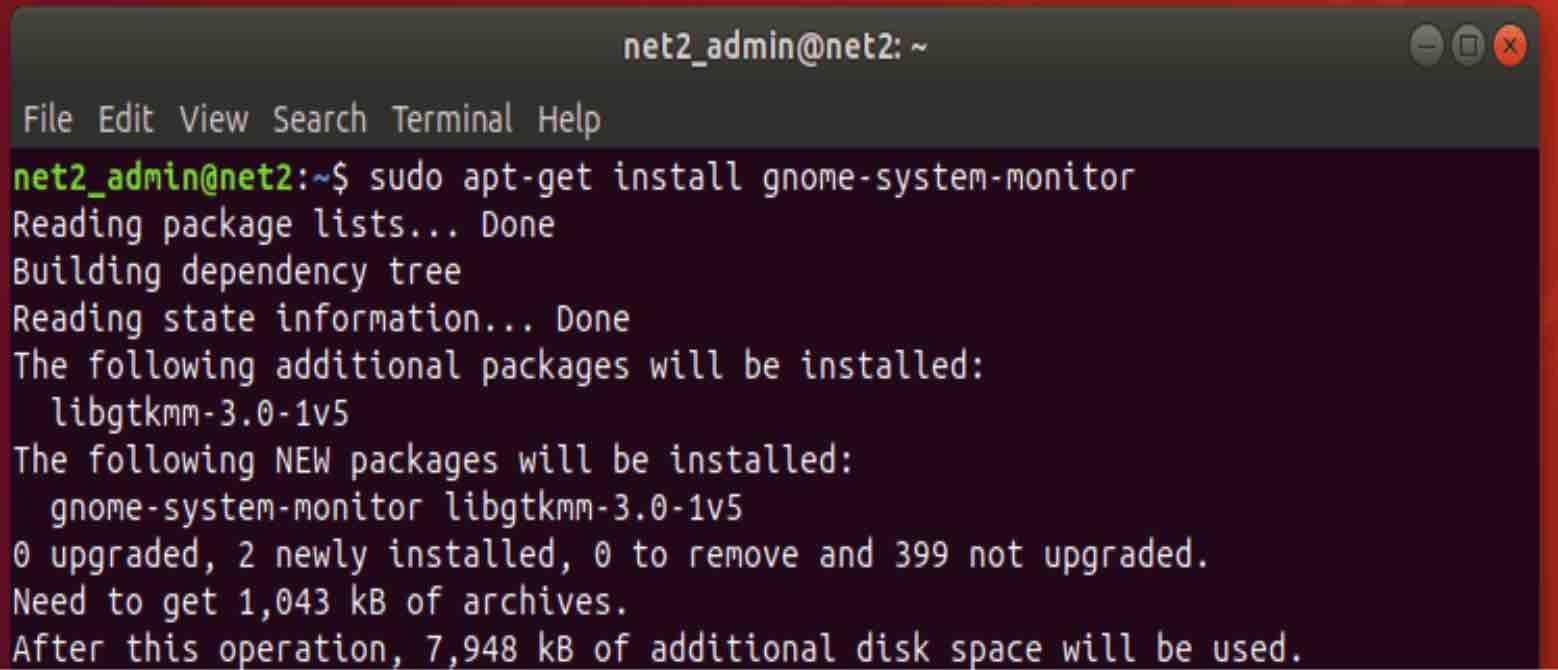
The GNOME System Monitor is a pre-installed graphical user interface (GUI) system monitoring tool for Ubuntu and other Linux distributions that use the GNOME desktop environment. It is similar to the Task Manager for Windows users and allows you to monitor all active processes in real time, as well as stop or resume processes. To install the GNOME System Monitor, enter the following command in the terminal
sudo apt-get install gnome-system-monitor
Then type in the following command to open it.
gnome-system-monitor
If you do not want to use the terminal, you can install the GNOME system monitor via a GUI. Just follow the steps below.
-
-
- Open the Software app from the activity toolbar.
- In the search bar type in gnome system-monitor and click search.
- Now click on the gnome system monitor to install it.
- After installation click launch to start the application.
-
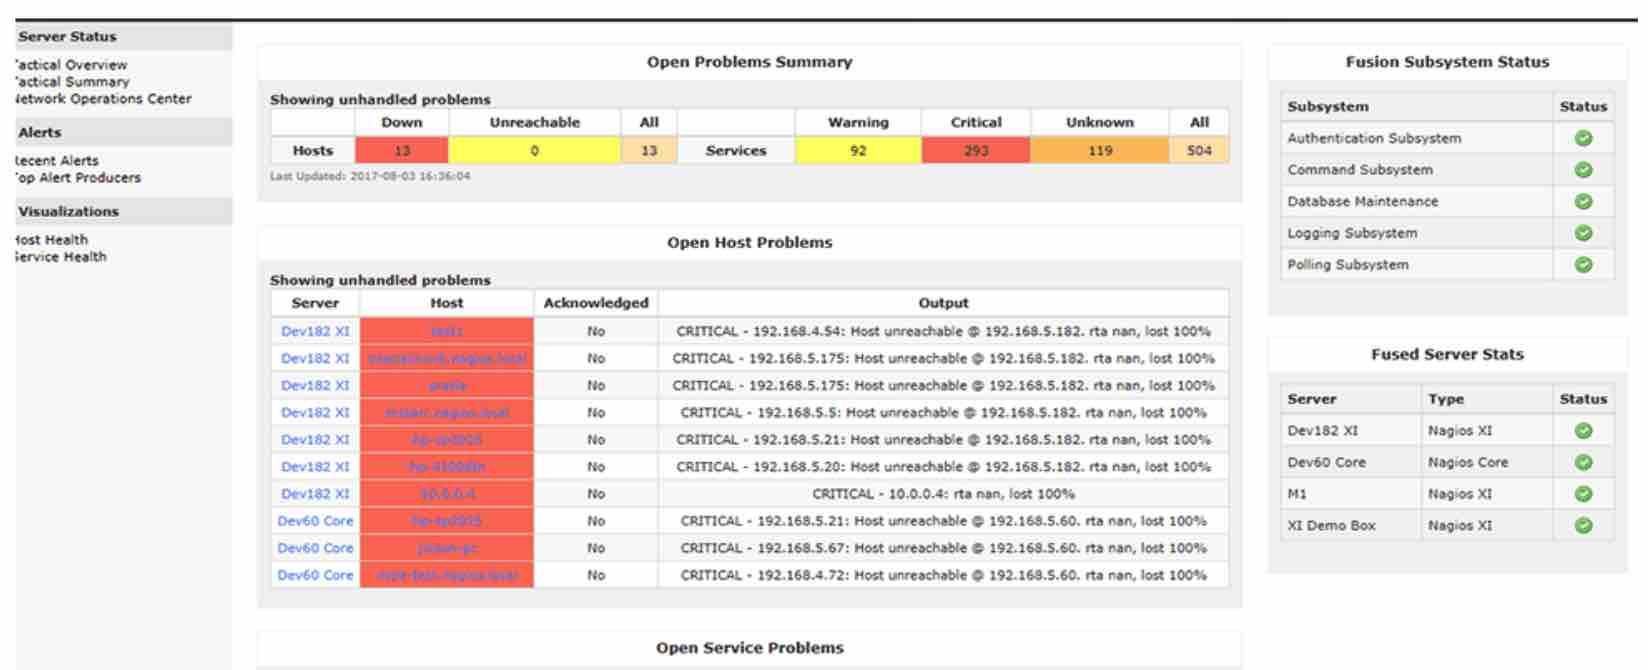
Nagios
Nagios is an open-source system monitoring tool. Nagios monitors current running processes, CPU load, memory usage, SMTP (simple, mail transfer protocol), POP3 (post office protocol), and many more. You can use it with CLI too. Nagios comes with script support, so that you can use it remotely.
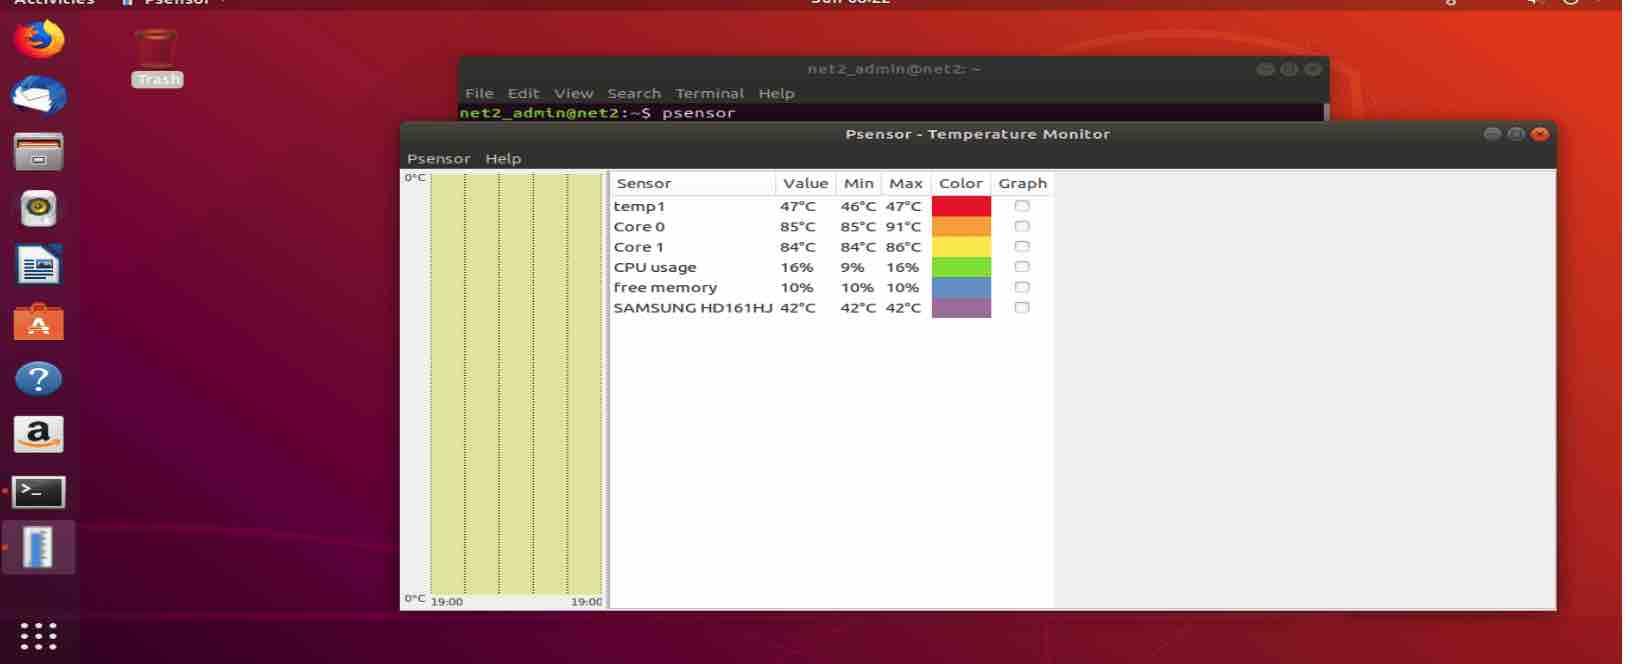
Psensor
Psensor is the best GUI based temperature monitoring tool. Psensor can check motherboard, CPU, Nvidia GPU, hard disk temperatures and many more. To use Psensor, you need to install lm-sensor as mentioned above. To install Psensor enter the following command in the terminal :
sudo apt install psensor
Then
psensor
Please let us know if we missed some other Linux monitoring tools.
If you like the content, we would appreciate your support by buying us a coffee. Thank you so much for your visit and support.