Working with large log datasets is a daily reality for system administrators. To effectively analyze system behavior, diagnose issues, and monitor performance, filtering these logs is essential.
This guide explores the powerful filtering capabilities of journalctl, a vital tool for anyone managing modern Linux systems using systemd. Let’s dive into how you can leverage these options to make sense of your system logs.
What exactly is journalctl?
journalctl is your command-line interface for querying and viewing the logs the journal collects. Unlike traditional flat log files, the systemd journal gathers logs from various sources into a centralized, structured, and indexed repository. This structure is key – it allows journalctl to perform sophisticated searches and filtering, making it much easier for sysadmins to pinpoint specific events, errors, or messages related to particular services, users, or timeframes within potentially massive log volumes. Understanding how to use journalctl effectively is a core skill for modern Linux administration.
Read: How to clear systemd journal Logs
Discovering Available Filter Fields in journalctl
Throughout this guide, we’ll be using various fields to filter log entries. The journal stores a wealth of metadata for each log entry. To see a comprehensive list of all possible fields you can filter by, you can consult the manual page specifically for journal fields. Just run this command in your terminal:
man systemd.journal-fieldsThis command provides detailed descriptions of fields like _SYSTEMD_UNIT, _PID, _UID, _HOSTNAME, and many others you can use for targeted log analysis.
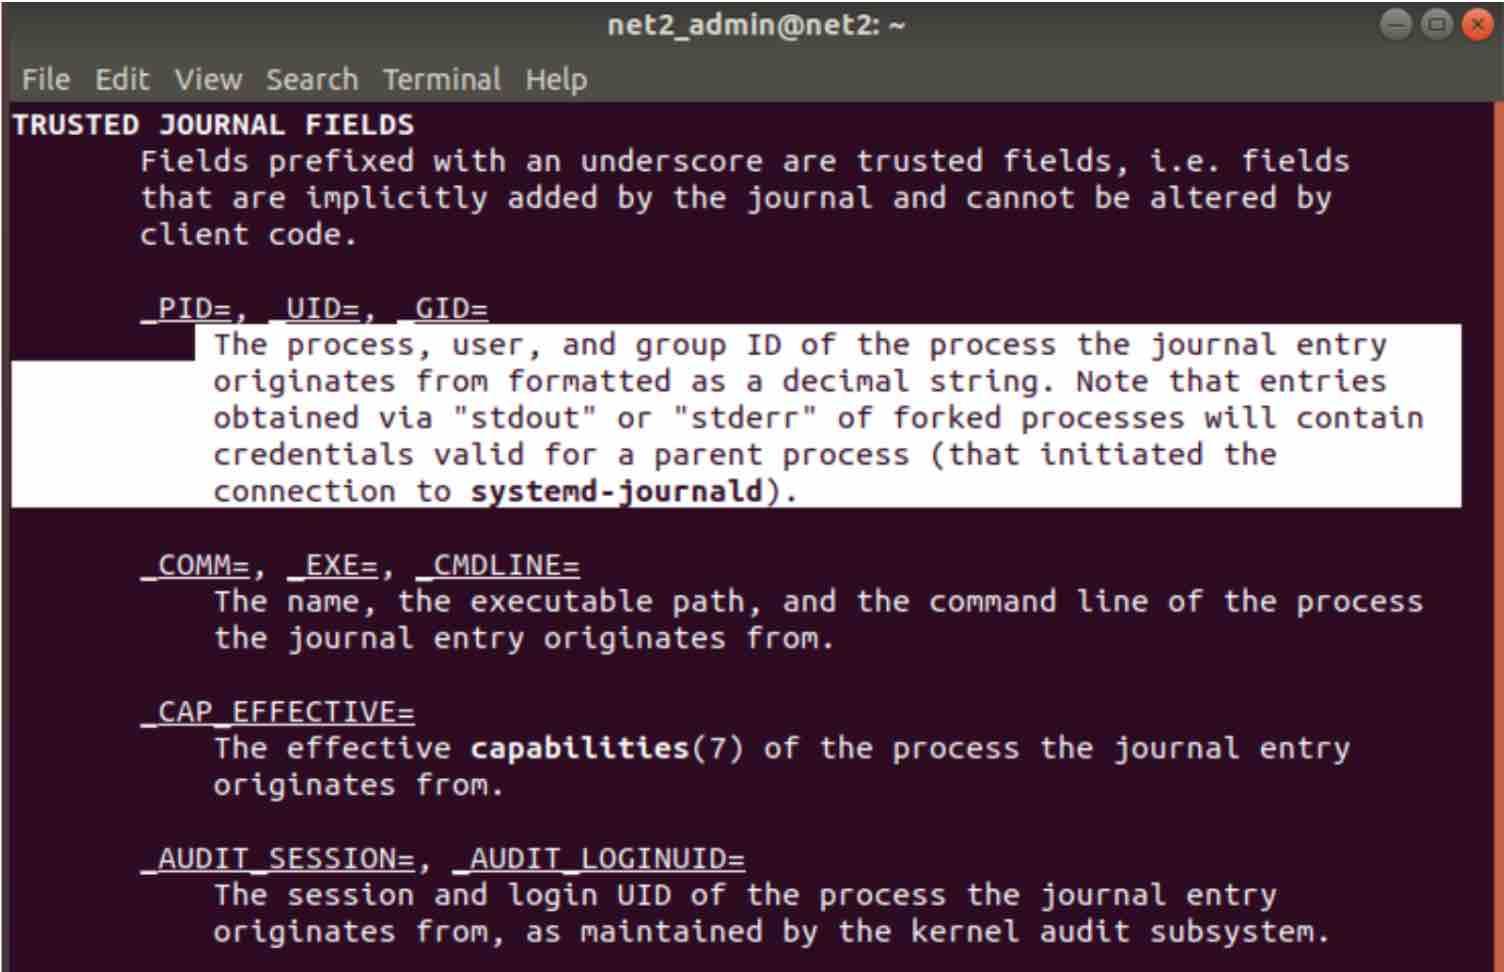
Exploring available journal fields with `man systemd.journal-fields`
Read: How To Fix “failed to start ntpd.service : unit ntpd.service not found” Error in Ubuntu
1. Filtering Logs by Time Window
Often, you’ll need to investigate events that happened during a specific period. This is especially useful on systems with long uptimes where logs can grow very large. journalctl offers the --since and --until options to precisely narrow down log entries based on timestamps. This is crucial for tasks like troubleshooting issues within a specific timeframe journalctl.
For example, to view all logs generated *since* March 11th, 2019, at 3:05 PM, you would use:
journalctl --since "2019-03-11 15:05:00"The standard time format expected is:
YYYY-MM-DD HH:MM:SSSome helpful defaults apply:
- If you omit the date (
YYYY-MM-DD),journalctlassumes the current date. - If you omit the time (
HH:MM:SS), it defaults to the beginning of the day (“00:00:00”). - If you omit the seconds (
:SS), it defaults to “00”.
You can combine --since and --until to define a precise interval. For instance, to see logs between two specific dates and times:
journalctl --since "2019-03-11 15:05:00" --until "2019-04-11 15:05:00"journalctl is also quite intuitive with relative time references. It understands terms like “yesterday,” “today,” “now,” “tomorrow,” and “ago.”
To retrieve all log entries from yesterday:
journalctl --since yesterdayOr, for a more complex relative range, like logs from 11 PM last night up until one hour ago:
journalctl --since 23:00 --until "1 hour ago"2. Viewing Logs from the Most Recent Reboot
To quickly analyze events that have occurred only since the system last started up, use the -b (boot) flag. This is incredibly handy for troubleshooting startup issues or problems that manifest shortly after a reboot.
journalctl -bWhen viewing the full journal, you’ll notice that log entries from different boot sessions are separated by a line like -- Reboot --. The -b flag effectively shows you everything after the most recent occurrence of that line. This helps in analyzing system behavior after last boot journalctl.
3. Accessing Logs from Past Boot Sessions
Sometimes, the information you need resides in logs from previous system boots. Investigating issues that occurred before the last restart requires accessing this historical data. By default, however, journald might not save logs persistently across reboots.
Understanding Journal Persistence
Out-of-the-box, journald often stores logs in memory or temporarily under the /run/log/journal/ directory. This is called “volatile” storage – the logs disappear when the system reboots. If this temporary storage fills up, the oldest entries get discarded.
How to Enable Persistent Logging
To ensure logs survive reboots, you need to enable persistent storage. There are two primary ways to achieve this, crucial for making systemd journal logs permanent:
Method A: Create the Journal Directory Manually
You can simply create the directory where persistent logs are stored. Run the following command as root:
mkdir -p /var/log/journal/After creating the directory, you need to tell the journald service to recognize this change by restarting it:
systemctl restart systemd-journaldKeep in mind that enabling persistent logging will consume disk space over time. Monitor usage and consider log rotation or size limits (configurable in `journald.conf`).
Read: How to fix high memory usage in Linux
Method B: Edit the journald Configuration File
Alternatively, you can explicitly configure the storage behavior by editing the main configuration file for journald:
sudo nano /etc/systemd/journald.conf![]()
Inside the file, locate the [Journal] section. Find the line starting with Storage= (it might be commented out with a # initially).
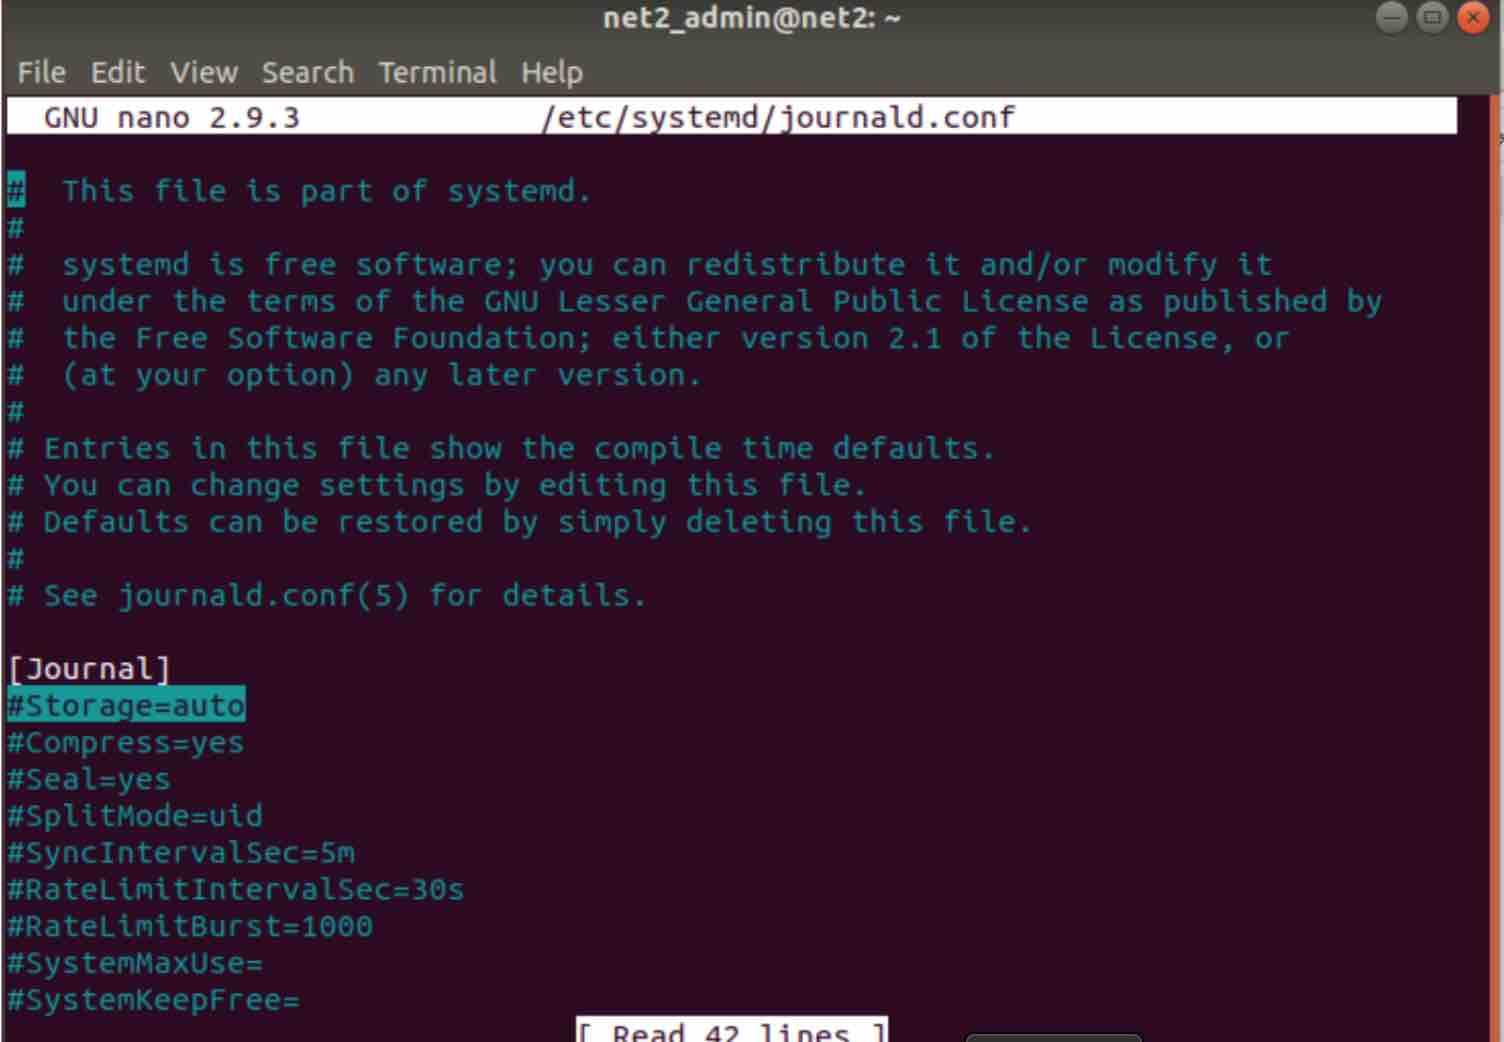
Uncomment the line (remove the # if present) and set the value to persistent:
[Journal]
Storage=persistent
Save the file and exit the editor. Then, restart the journald service for the change to take effect:
systemctl restart systemd-journaldThe Storage= option can accept several values:
| Value | Description |
|---|---|
none | Disables all journal storage. Received logs are dropped (though forwarding via syslog, console, etc., might still work). |
volatile | Stores logs only in memory (typically under /run/log/journal). Logs are lost on reboot. This is often the default if /var/log/journal doesn’t exist. |
persistent | Stores logs on disk under /var/log/journal (creating it if needed). If this location isn’t writable, it falls back to volatile storage. This ensures logs survive reboots. |
auto | Acts like persistent if /var/log/journal exists. If not, it uses volatile storage under /run/log/journal. This is often the default behavior. |
4. Listing Available Boot Sessions
Once you have persistent logging enabled (or if your system retains logs for a few boots by default), you can list all the boot sessions that journalctl knows about. Use the --list-boots option:
journalctl --list-boots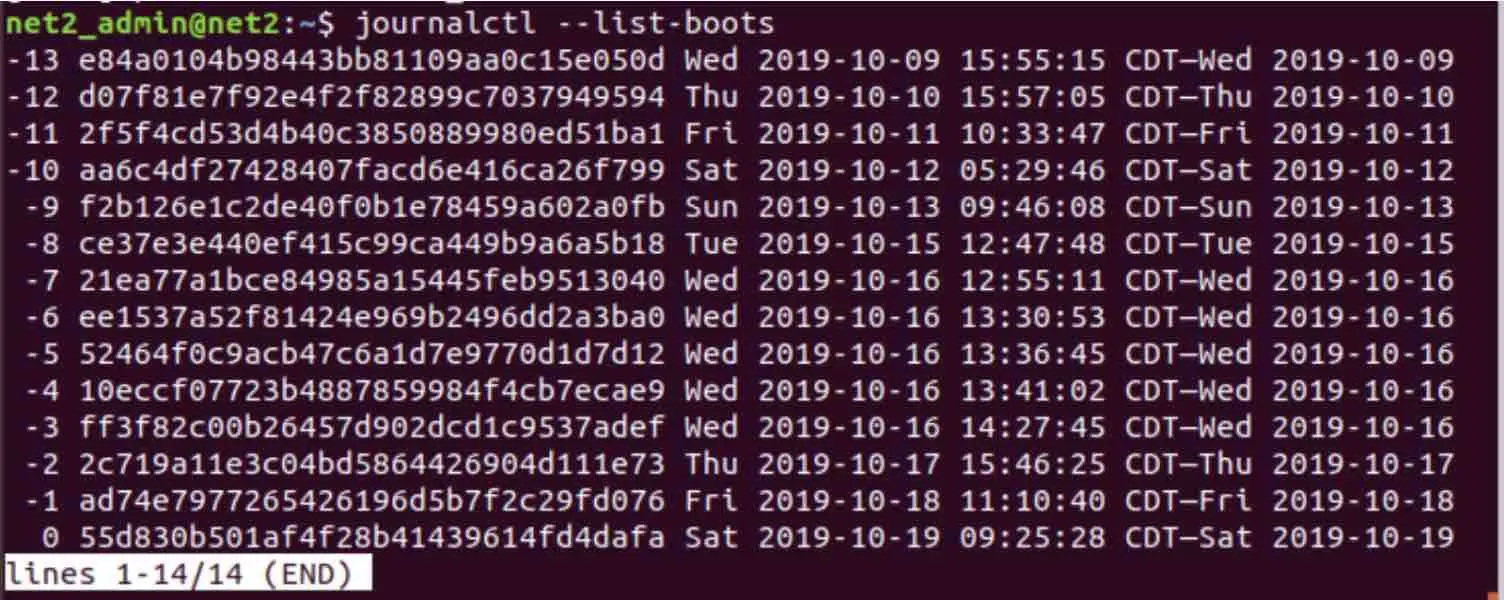
Listing previous boot sessions known to journalctl
The output shows each boot session on a separate line:
- The first column is a relative offset:
0is the current boot,-1is the previous one,-2is the one before that, and so on. - The second column is the unique Boot ID. This is a stable identifier for the boot session.
- The end of the line shows the timestamp range covered by that boot session.
You can use either the relative offset or the Boot ID with the -b flag to view logs specifically from that session. For example, to see logs from the boot session before the previous one (offset -2):
journalctl -b -2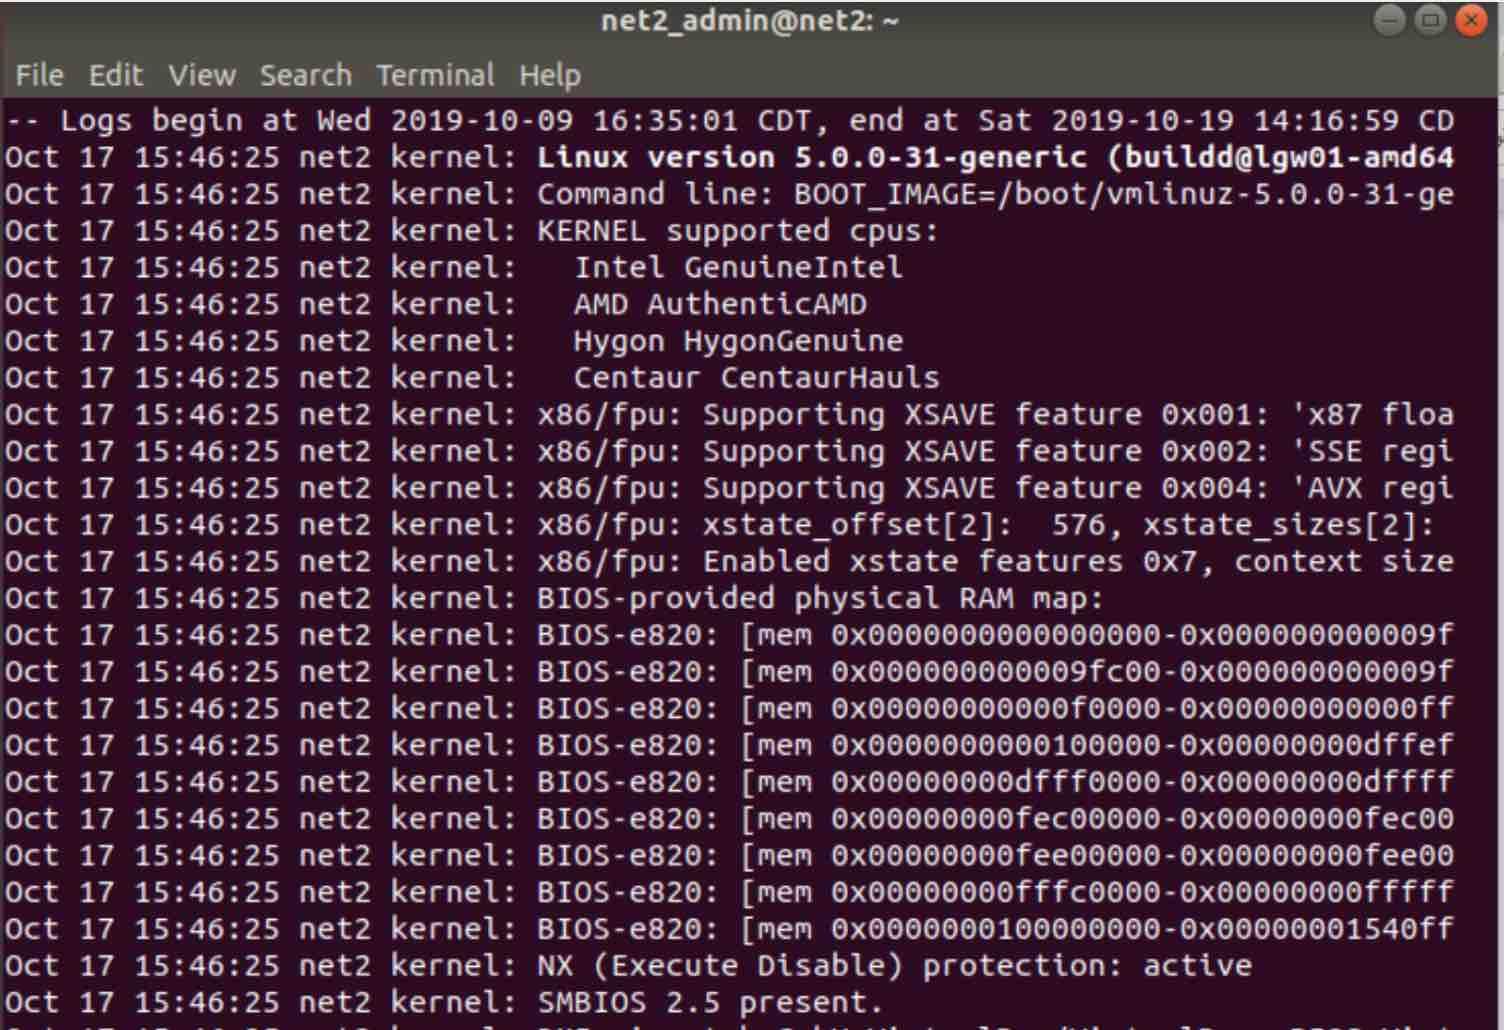
Alternatively, using the Boot ID from the --list-boots output yields the same result (replace the ID with one from your output):
journalctl -b 2c719a11e3c04bd5864426904d111e73This makes viewing logs from a specific past boot journalctl straightforward.
5. Displaying the Most Recent Log Entries
To quickly see the latest log messages, similar to using the tail command, you can use the -n (or --lines) option followed by the number of lines you want to display.
For example, to show the 20 most recent log entries:
journalctl -n 20
Using `journalctl -n` to view recent log entries
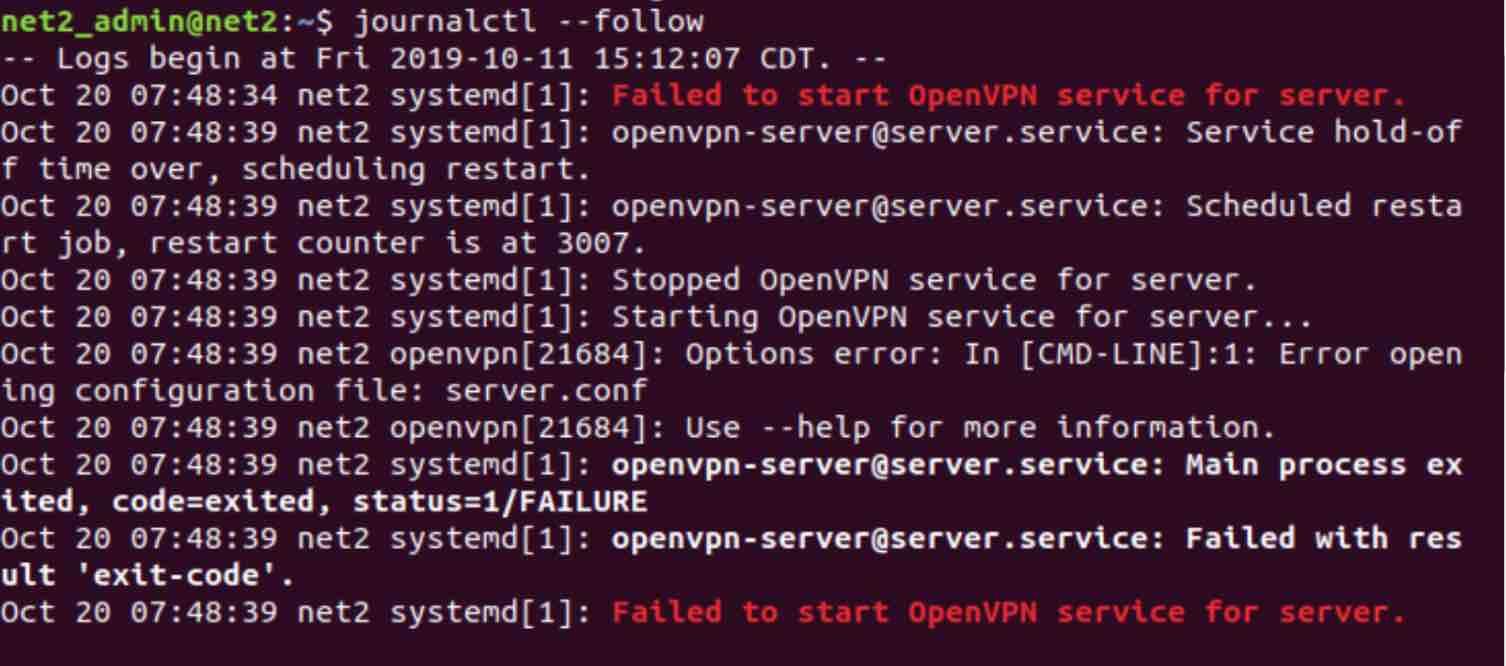
If you want to continuously monitor new log entries as they arrive (like tail -f), use the -f (or --follow) option:
journalctl -fPress Ctrl+C to stop following the log output.
6. Filtering Logs by Service or Process
One of the most powerful features of journalctl is its ability to filter logs based on the specific systemd service, process ID, user ID, or group ID that generated them. This is invaluable for isolating issues related to a particular application or component.
Read: How to use systemd to troubleshoot Linux problems
a. Filtering by systemd Service Unit
To view logs only for a specific systemd service unit, use the -u (or --unit) option followed by the service name (e.g., ssh.service, nginx.service, mysql.service). This helps in checking journalctl logs for a specific service unit.
journalctl -u ssh.service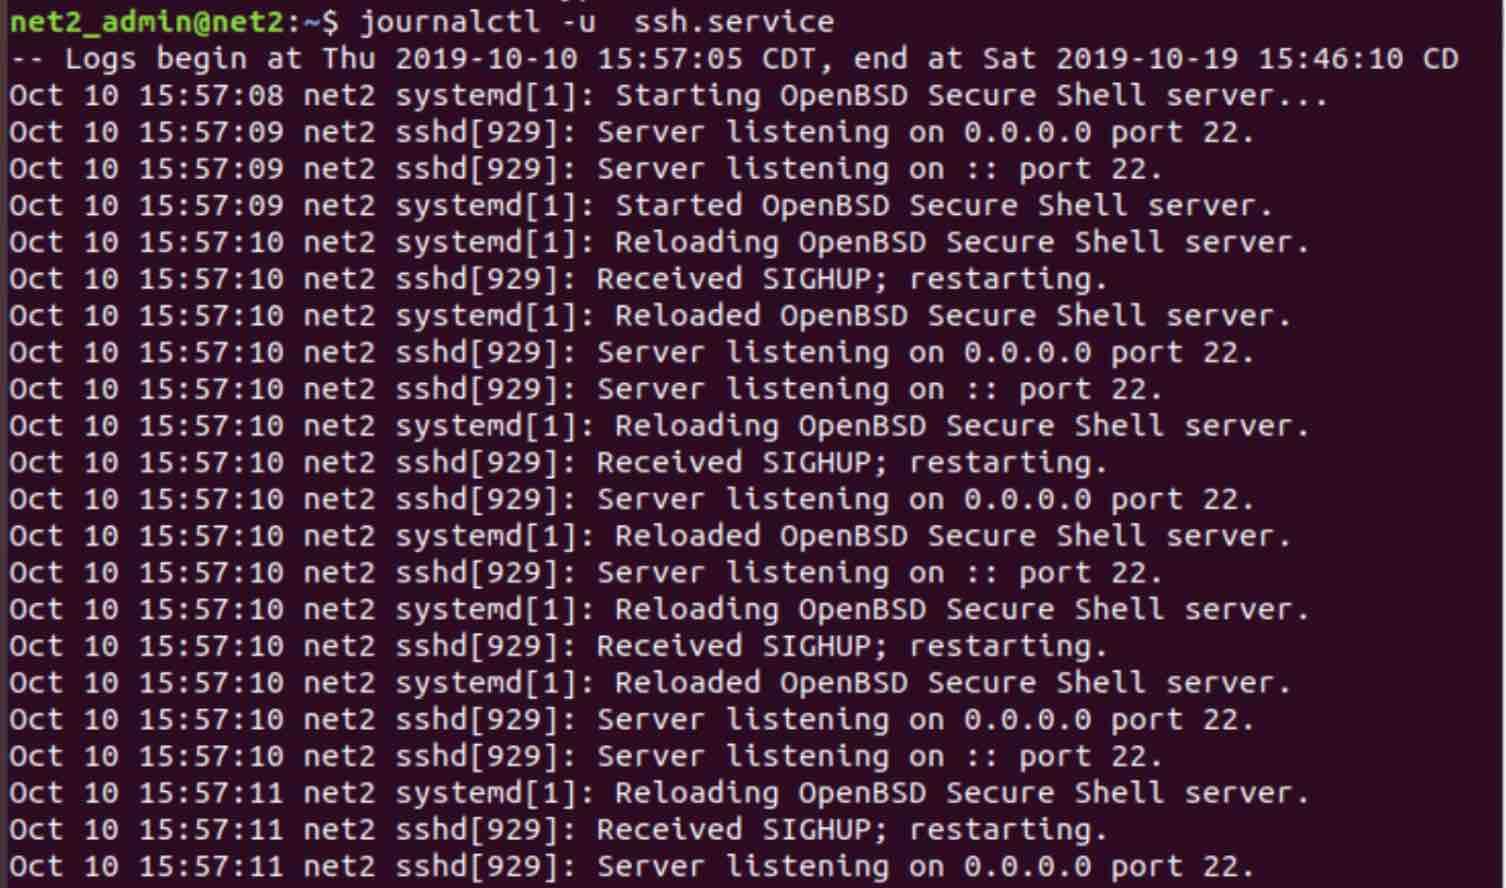
Read: Ubuntu/Debian monitoring tools guide for system administrators
You can combine this with time filters. For example, to see SSH service logs from yesterday until today:
journalctl -u ssh.service --since yesterday --until todayIt’s also possible to view interleaved logs from multiple service units simultaneously. This is extremely useful when troubleshooting interactions between dependent services. Just provide multiple -u options:
journalctl -u nginx.service -u php-fpm.service --since "1 hour ago"This command would show combined logs from both Nginx and PHP-FPM from the last hour, ordered chronologically.
b. Filtering by Process ID (PID)
If you know the Process ID (PID) of a running process you want to investigate, you can filter the journal using the _PID field.
journalctl _PID=901This command retrieves all log entries associated with the process that had PID 901. Remember that PIDs can be reused after a process exits, so combining this with time filters (--since, --until) is often wise for accuracy.
c. Filtering by User ID (UID) or Group ID (GID)
You can also filter logs based on the user or group that owns the process generating the log entry. Use the _UID field for User ID or _GID for Group ID.
To display logs generated by processes running under User ID 844 since today:
journalctl _UID=844 --since todayIf you know the username but not the UID, you can easily find the UID using the id command:
id -u Replace with the actual username. Then use the resulting UID with the _UID= filter.
7. Listing Unique Values for a Filter Field
A particularly handy feature for exploring your logs is the ability to list all unique values present in the journal for a specific field. Use the -F (or --field) option followed by the field name.
For example, to see all unique User IDs (_UID) that have generated log entries stored in the journal:
journalctl -F _UID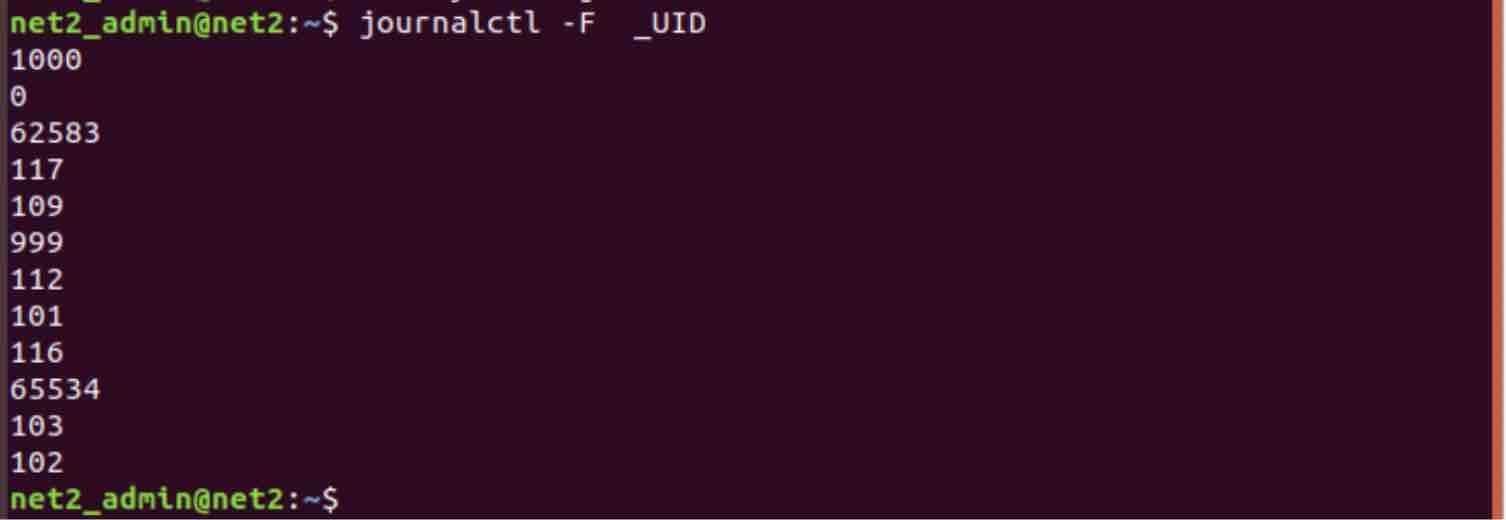
This can be applied to any other field, such as _PID, _GID, _SYSTEMD_UNIT, _HOSTNAME, etc. It’s a great way to quickly understand the range of services, users, or hosts contributing to your logs. This helps in discovering all services logging to journalctl.
8. Displaying Kernel Messages (like dmesg)
To view only messages generated by the Linux kernel, which traditionally appear in the output of the dmesg command, you can use the -k (or --dmesg) flag with journalctl.
journalctl -k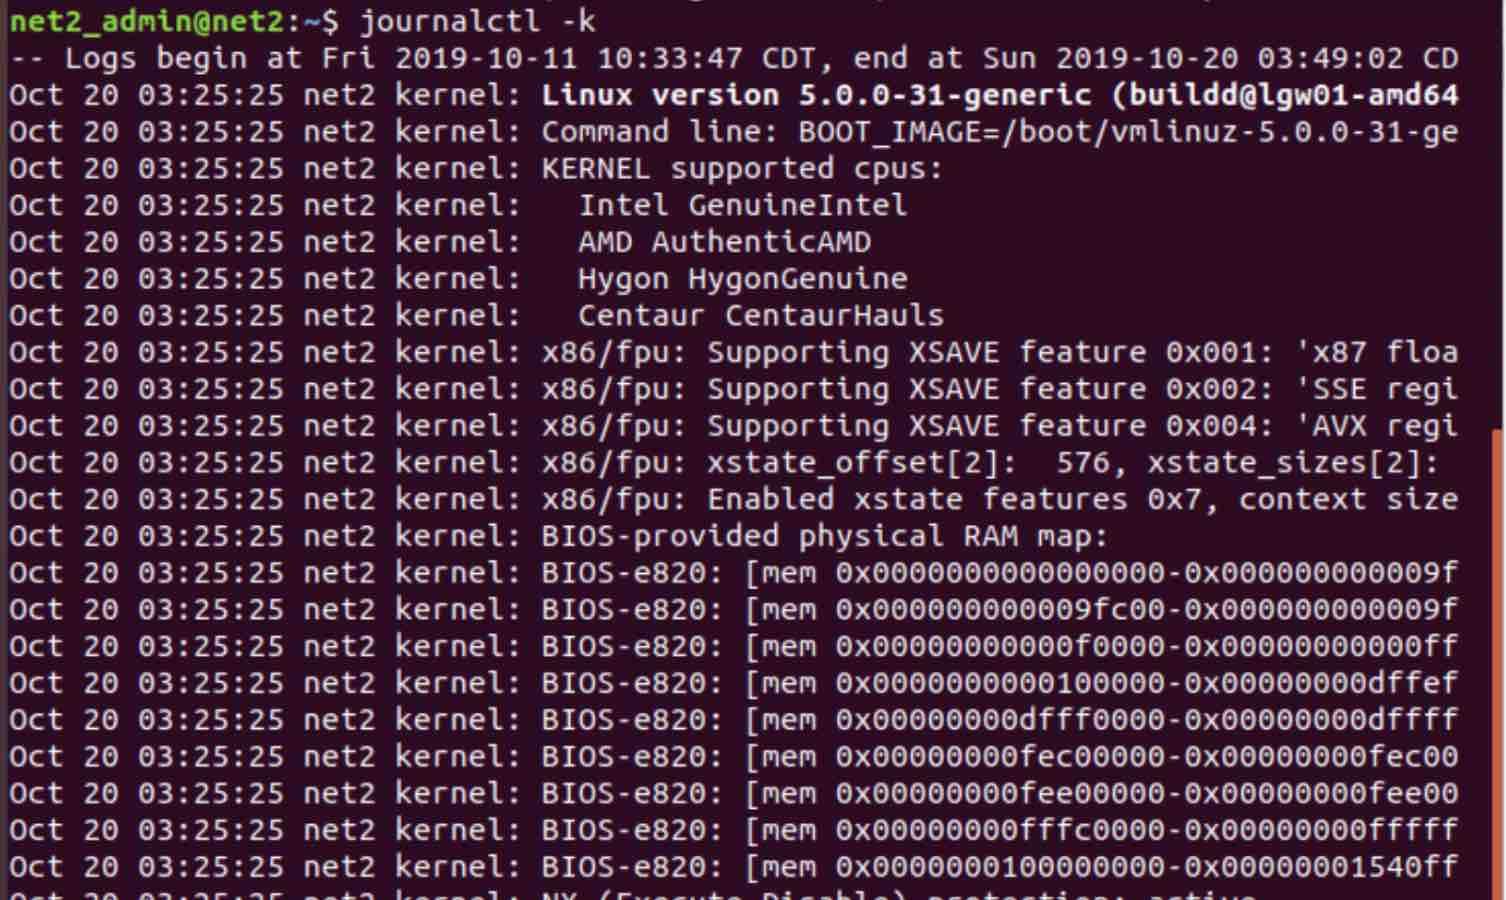
By default, this shows kernel messages from the current boot session. To view kernel messages from a previous boot, combine it with the boot selection flags discussed earlier (e.g., -b -1 for the previous boot, -b for a specific boot ID).
For instance, to retrieve kernel messages from four boots ago:
journalctl -k -b -4This functionality makes viewing kernel ring buffer messages via journalctl very convenient.
9. Filtering Logs by Message Priority
System administrators often need to focus on high-priority messages like errors or critical alerts, filtering out informational or debug-level noise. journalctl allows filtering by message priority using the -p (or --priority) option.
The journal uses standard syslog priority levels. You can specify a priority level by its name or its corresponding numeric value. Providing a level will show messages at that level *and all higher levels*.
Here are the standard priority levels, ordered from highest (most critical) to lowest:
| Numeric Value | Name | Description |
|---|---|---|
| 0 | emerg | System is unusable |
| 1 | alert | Action must be taken immediately |
| 2 | crit | Critical conditions |
| 3 | err | Error conditions |
| 4 | warning | Warning conditions |
| 5 | notice | Normal but significant condition |
| 6 | info | Informational messages |
| 7 | debug | Debug-level messages |
For example, to view all messages with a priority of “error” (err, level 3) or higher (critical, alert, emergency) from the current boot session:
journalctl -p err -bOr using the numeric equivalent:
journalctl -p 3 -b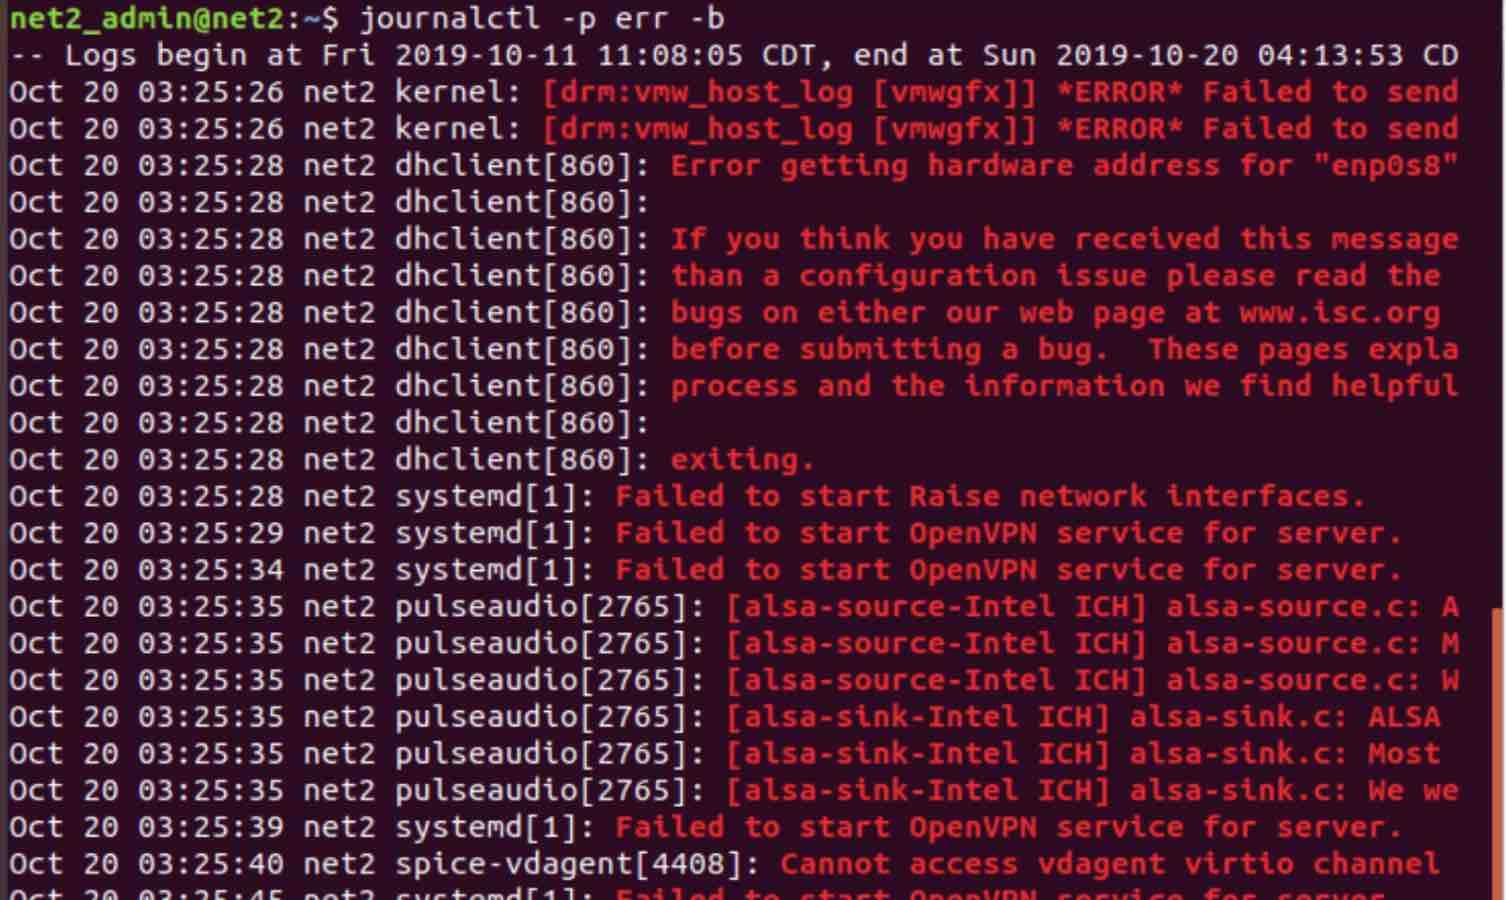
This is extremely useful for quickly identifying critical problems and helps with finding error messages quickly with journalctl. For even more specific text searching within these filtered results, you might pipe the output to `grep`.
Conclusion
The systemd journal and its query tool, journalctl, offer a remarkably powerful and flexible system for log management on modern Linux distributions. By mastering its advanced filtering options related to time, boot sessions, services, processes, users, kernel messages, and priority levels, system administrators can significantly streamline the process of debugging, analyzing system behavior, and resolving application issues. Taking the time to learn these features is a valuable investment for efficient system administration.
Frequently Asked Questions (FAQ)
- Q1: How do I filter journalctl logs between two specific dates and times?
- Use both the
--sinceand--untiloptions together with timestamps in the"YYYY-MM-DD HH:MM:SS"format. Example:journalctl --since "2023-10-26 09:00:00" --until "2023-10-26 17:30:00". - Q2: What’s the easiest way to see only error messages from the current boot in journalctl?
- Combine the priority filter
-p err(or-p 3) with the current boot filter-b. The command is:journalctl -p err -b. This shows errors and more critical messages (crit, alert, emerg). - Q3: Can I view combined logs for multiple services simultaneously with journalctl?
- Yes, you can provide multiple
-uoptions in the same command.journalctlwill automatically interleave the log entries from the specified services in chronological order. Example:journalctl -u nginx.service -u mysql.service --since "10 minutes ago". - Q4: How do I make my systemd journalctl logs permanent across reboots?
- You need to enable persistent storage. Either create the directory
sudo mkdir -p /var/log/journal/or edit/etc/systemd/journald.confand setStorage=persistentunder the[Journal]section. Remember to restart the journald service afterwards:sudo systemctl restart systemd-journald. - Q5: How can I check kernel-specific messages using journalctl instead of dmesg?
- Use the
-kor--dmesgflag. For example,journalctl -kshows kernel messages from the current boot. To see kernel messages from the previous boot, usejournalctl -k -b -1.
If you like the content, we would appreciate your support by buying us a coffee. Thank you so much for your visit and support.


