In some circumstances, you may have noticed that your computer is running slow. This might be due to some applications that are consuming a big chunk of memory without you noticing it.
It could be that some services are using more RAM than usual even though Linux, which has an inherent memory management mechanism, can set aside otherwise free or unused memory for disk caching, which might help speed up your system.
In this article, we will try to see how to identify memory intensive applications and how to free up and manage memory for better performance .
In order to diagnose the memory usage, there are different tools that can help identify resource exhaustive apps.
The ‘top’ command
The ‘top’ command can display the processes that are eating up large amounts of memory. In order to see this in action, open up your terminal and type in:
top

Read: How to Fix WIFI not working on Ubuntu 22.04
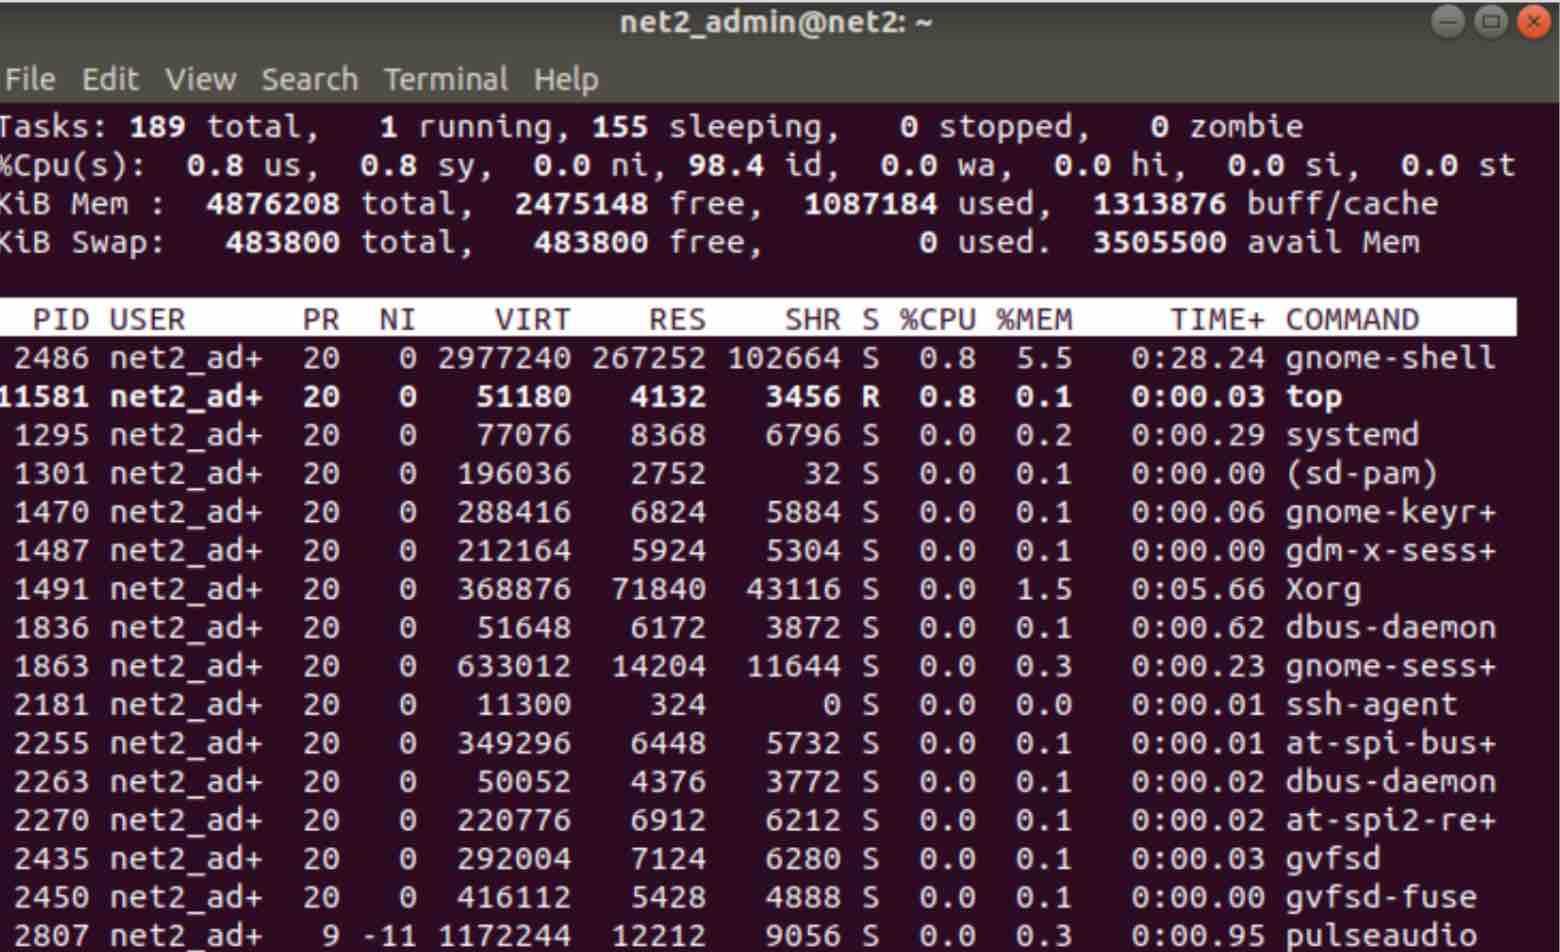
The top command provides an easy and dynamic real time overview of your system’s current workload.The list of threads and processes that are handled by the Linux kernel, is shown as a summarized interactive column based display where the processes’ statistics and resource usage is shown at the top half portion whereas the currently active list of processes is displayed at the lower half portion.
Here is a quick explanation of some of the important columns displayed by the top tool :
PID: The unique process id of the corresponding task.
USER: User name of the the corresponding task owner.
PR: Priority of the the corresponding task.
NI: ‘Nice’ Value of the corresponding task. A Negative ‘nice’ value indicates a higher priority whereas a positive ‘nice’ implies a priority.
VIRT: Total virtual memory currently used by the corresponding task.
RES: Resident size (kb) is the non swapped physical memory the corresponding task has used
SHR: The amount of currently shared memory used by the corresponding task.
%CPU: The corresponding task’s share of the already elapsed CPU time since the last screen
update, expressed as a % of total CPU time.
TIME+: CPU Time to the hundredths of a second is the the same as ‘TIME’, but with more granularity though.
SHR: Represents the Shared Memory size (kb) used by the corresponding task.
%MEM: Memory usage of the corresponding task.
Remember to press q whenever you want to exit the current mode.
Specific user processes
In order to display processes for a specific user, just type in the command :
![]()
This will show the following screen for user net2_admin :
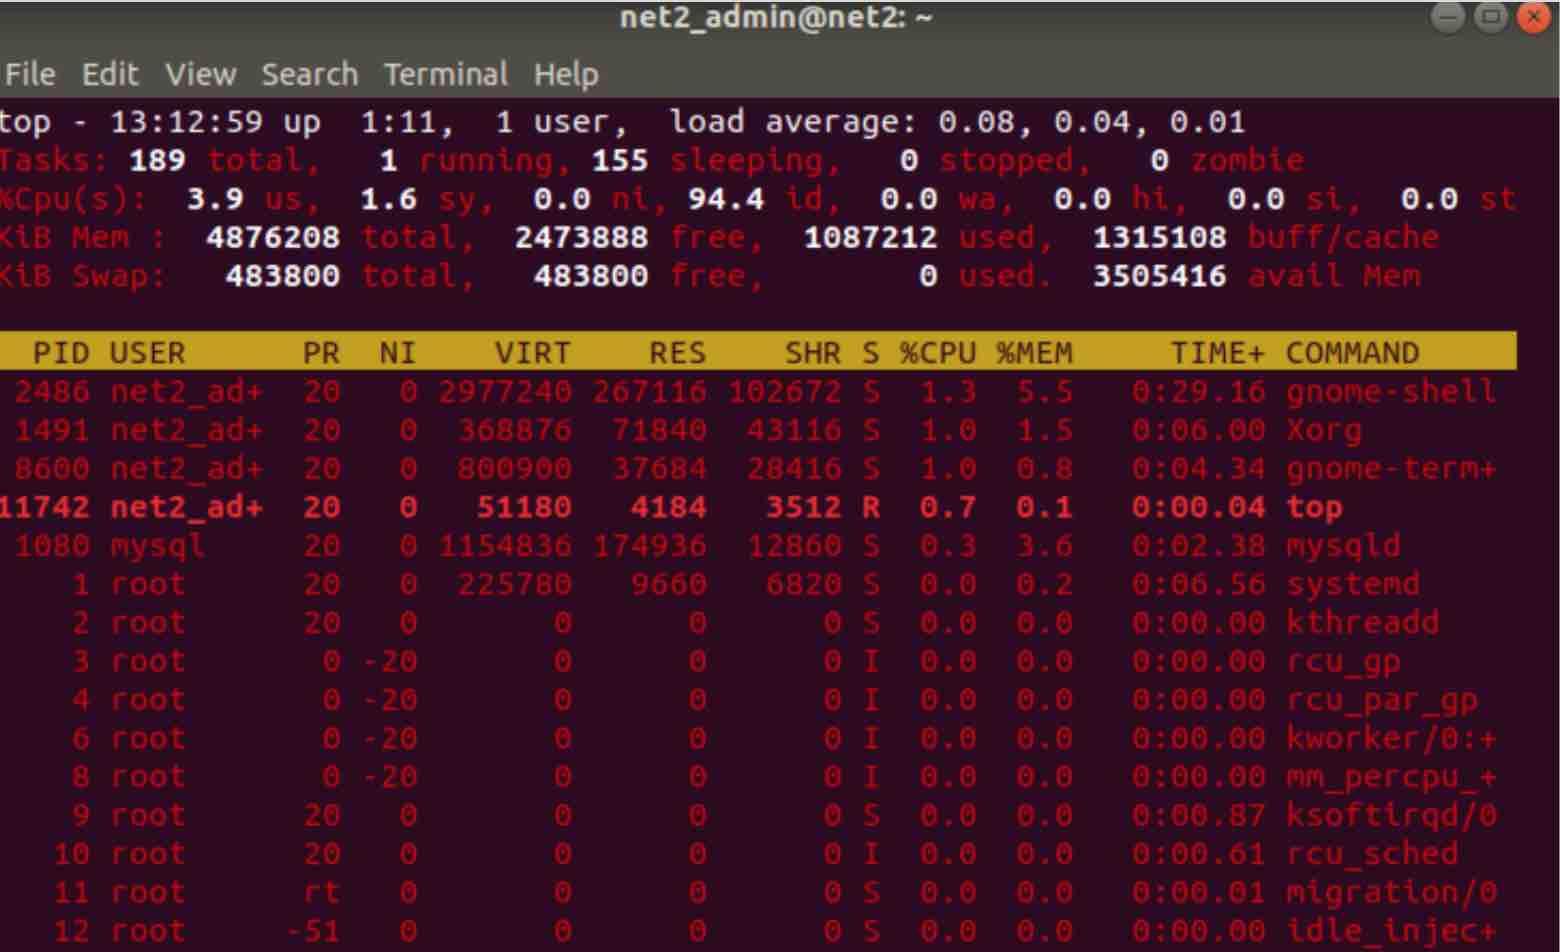
Running processing highlighting
When you press the ‘z‘ key while you are on running the top command, you will see currently running processes in different color for ease of identification.
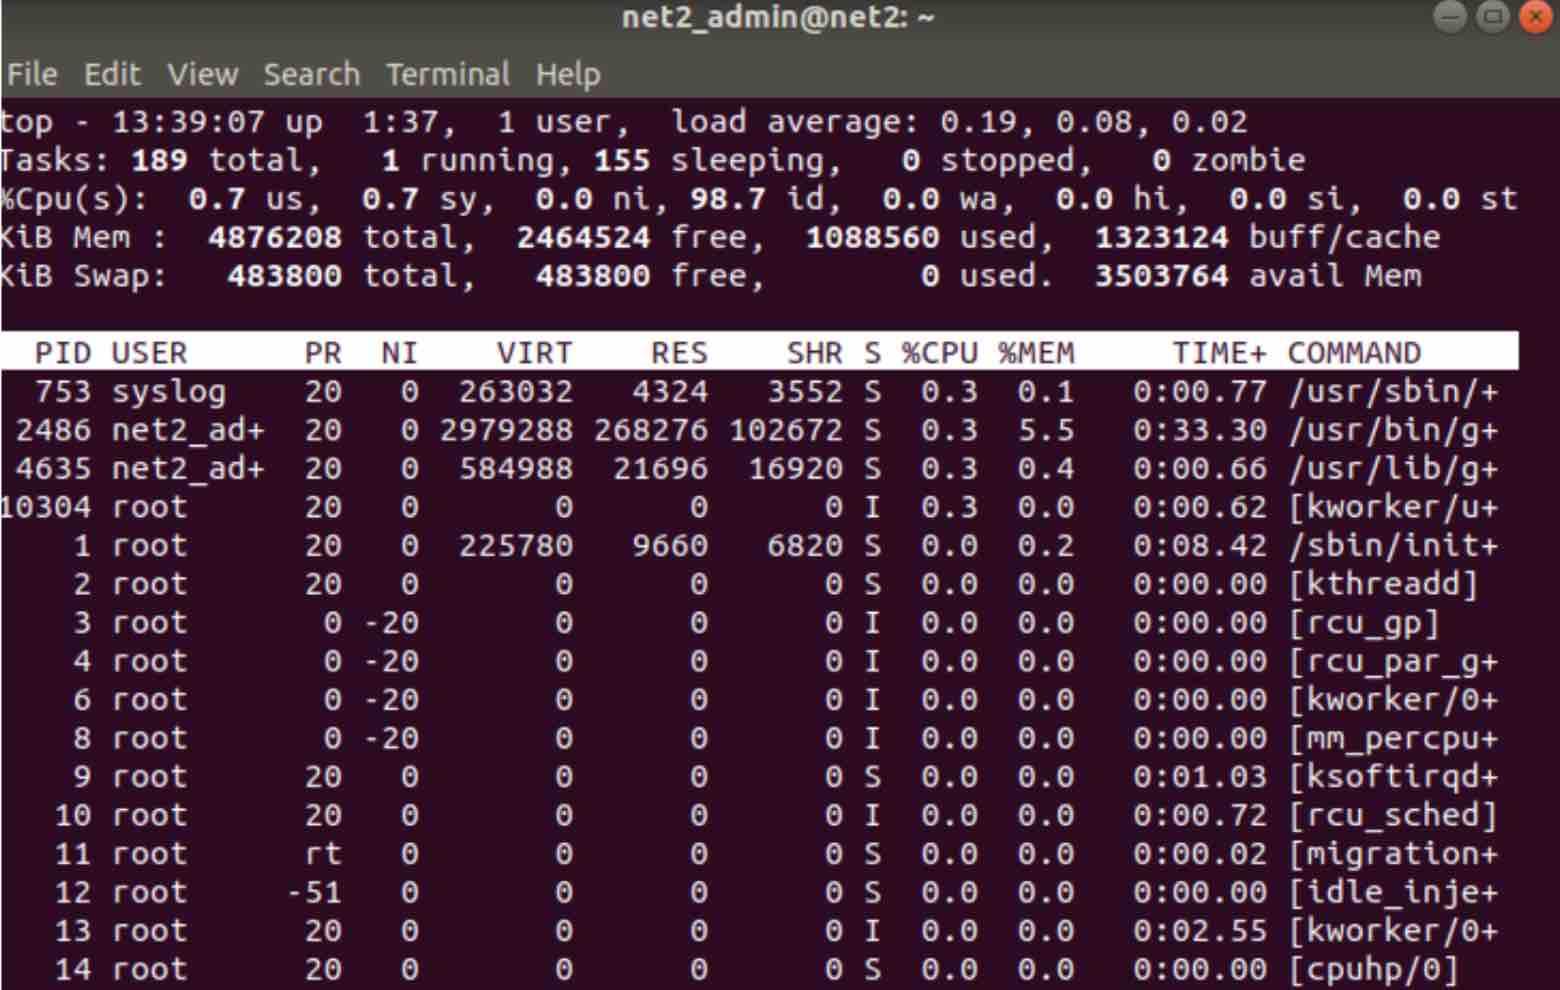
Processes absolute path
When you press ‘c‘ while running the top tool, you will see the absolute path of running processes as indicated in the snapshot below :
Read: How to fix Bluetooth connection issues on Ubuntu 22.04
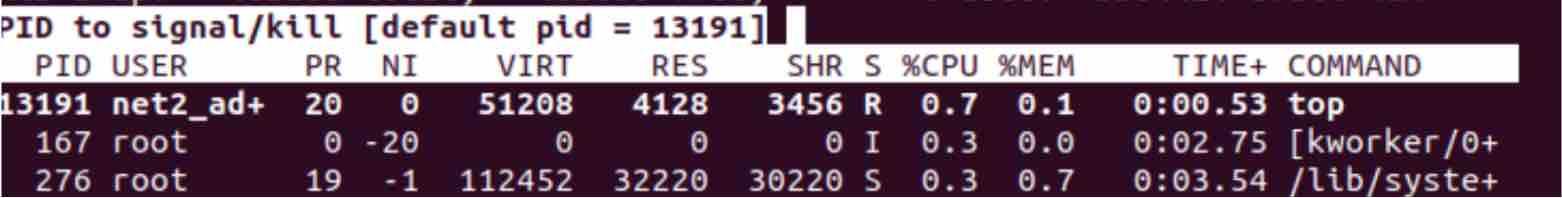
Running processes termination
When you press the ‘k’ key, you will be able to enter the PID of a process you want to kill. In the snapshot below you can see the location where you could enter the PID you wish to terminate.
Usually, processes that are killed all of a sudden can often be caused by the system running out of memory. It is at that moment that the so called OOM killer (Out-of-memory) steps in. If a task is terminated in order to save memory, it will be logged into several log files which are stored at /var/log/ .
In order to search for ‘out of memory’ message alerts in the log files, you can run the command :
sudo grep -i -r ‘out of memory’ /var/log/
Example log marks of killed processes by OOM, would look similar to the entry below :
kernel: Out of memory: Kill process 1163 (mysqld) score 511 or sacrifice child
This shows that the process that was terminated was mysqld with pid 1163. At the time it was killed, this has an OOM score of 511. Note that, depending on your current Linux distro and system configuration, your log messages may look different.
If for instance a process which is crucial to your web application was terminated due to an ‘out of memory’ situation, you have two options : either disallow processes to overcommit memory (see section at the end of this article), decrease the amount of memory required by the process or provide additional memory to your server configuration.
The ‘free’ tool
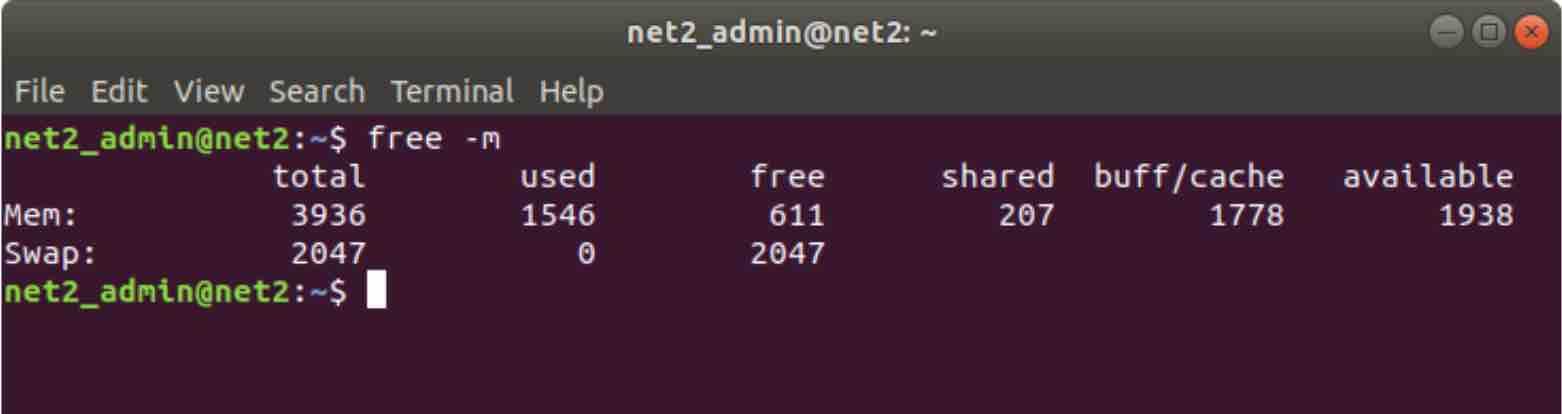
Another useful utility to diagnose RAM issues is the ‘free’ tool. The ‘free’ command shows the total amount of used and free swap and physical memory in the system. The caches and buffers used by the kernel are also displayed.
Just type in the following in the terminal :
free -m
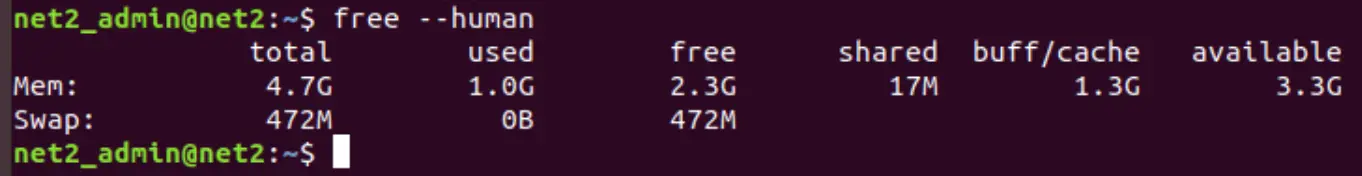
If you want a more human readable format, just run the command below :
free –human
Here is an explanation of the columns above :
total : The amount of total installed memory
used : The amount of used memory
free : The amount of unused memory
shared : The amount of memory used [mostly] by tmpfs
buffers : The amount of memory used by the kernel buffers
cache : The amount of memory used by slabs and the page cache
buff/cache : The sum of cache and buffers
available : An estimation of how much amount of memory is available in order to start new applications without a need for swapping.
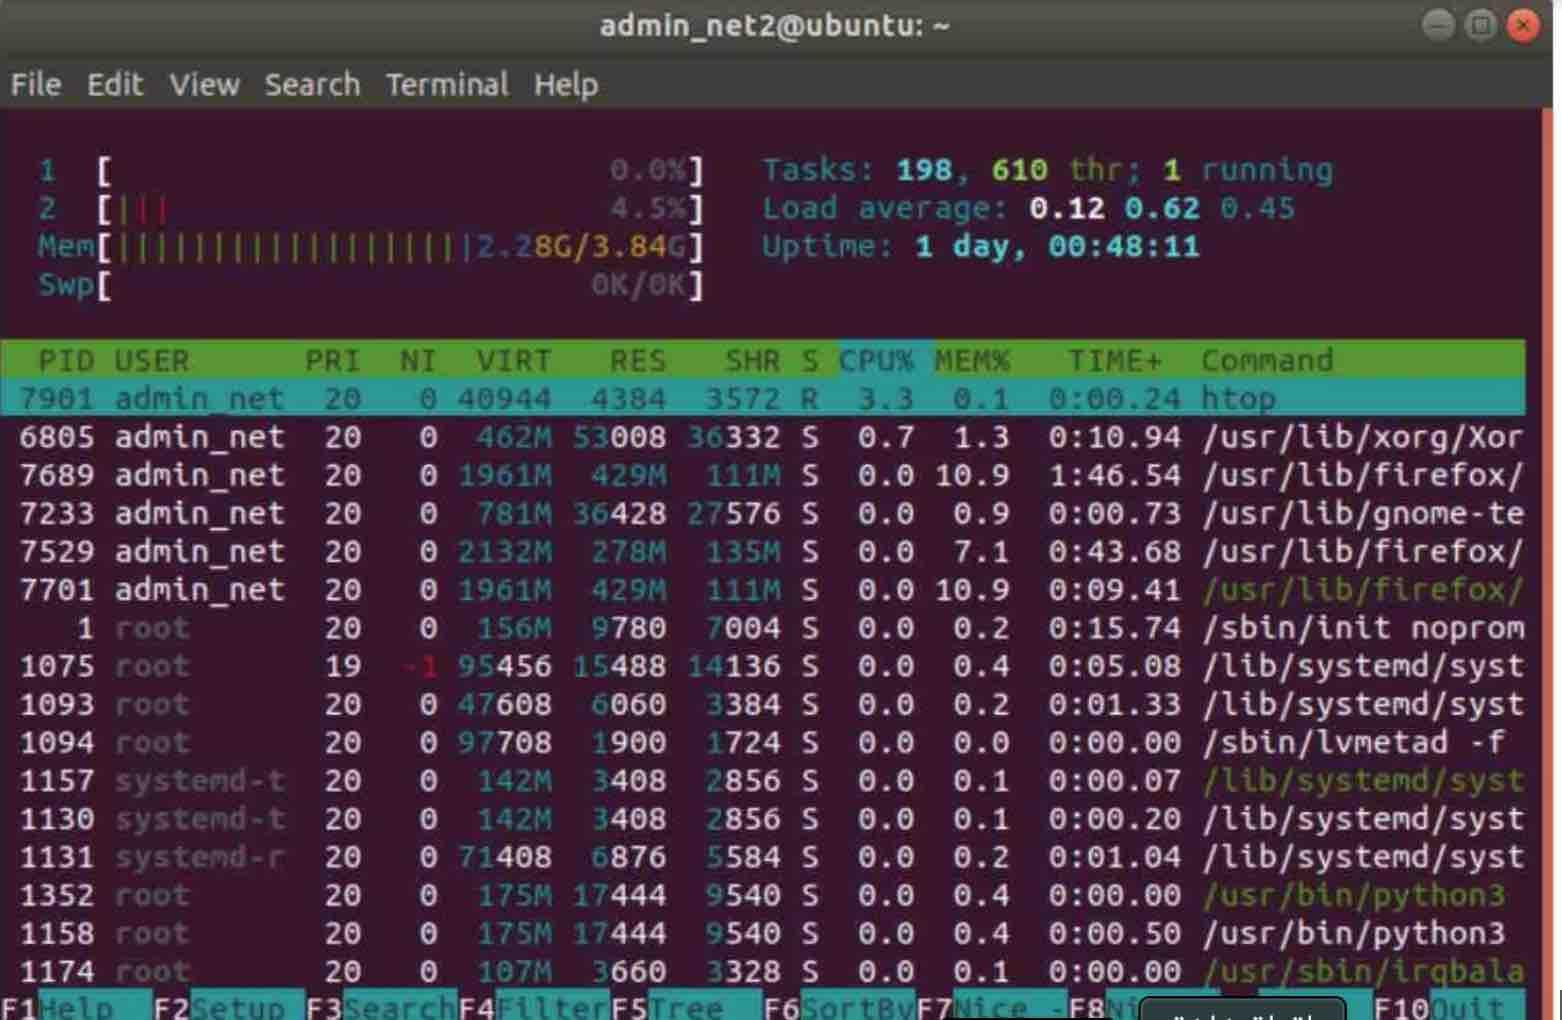
The ‘htop’ command
Much like the top tool above, htop is an interactive easy to read process viewer. It displays per process memory usage as well as other various parameters.
Read: How to list, start and stop services at boot time in Ubuntu
We have written a detailed article on how to install and use the htop tool here.
The ‘ps’ tool
In order to find out which applications are using the most amount of memory, you can use the command ‘ps; which is similar to ‘top’. Simply invoke it as follows:
ps aux
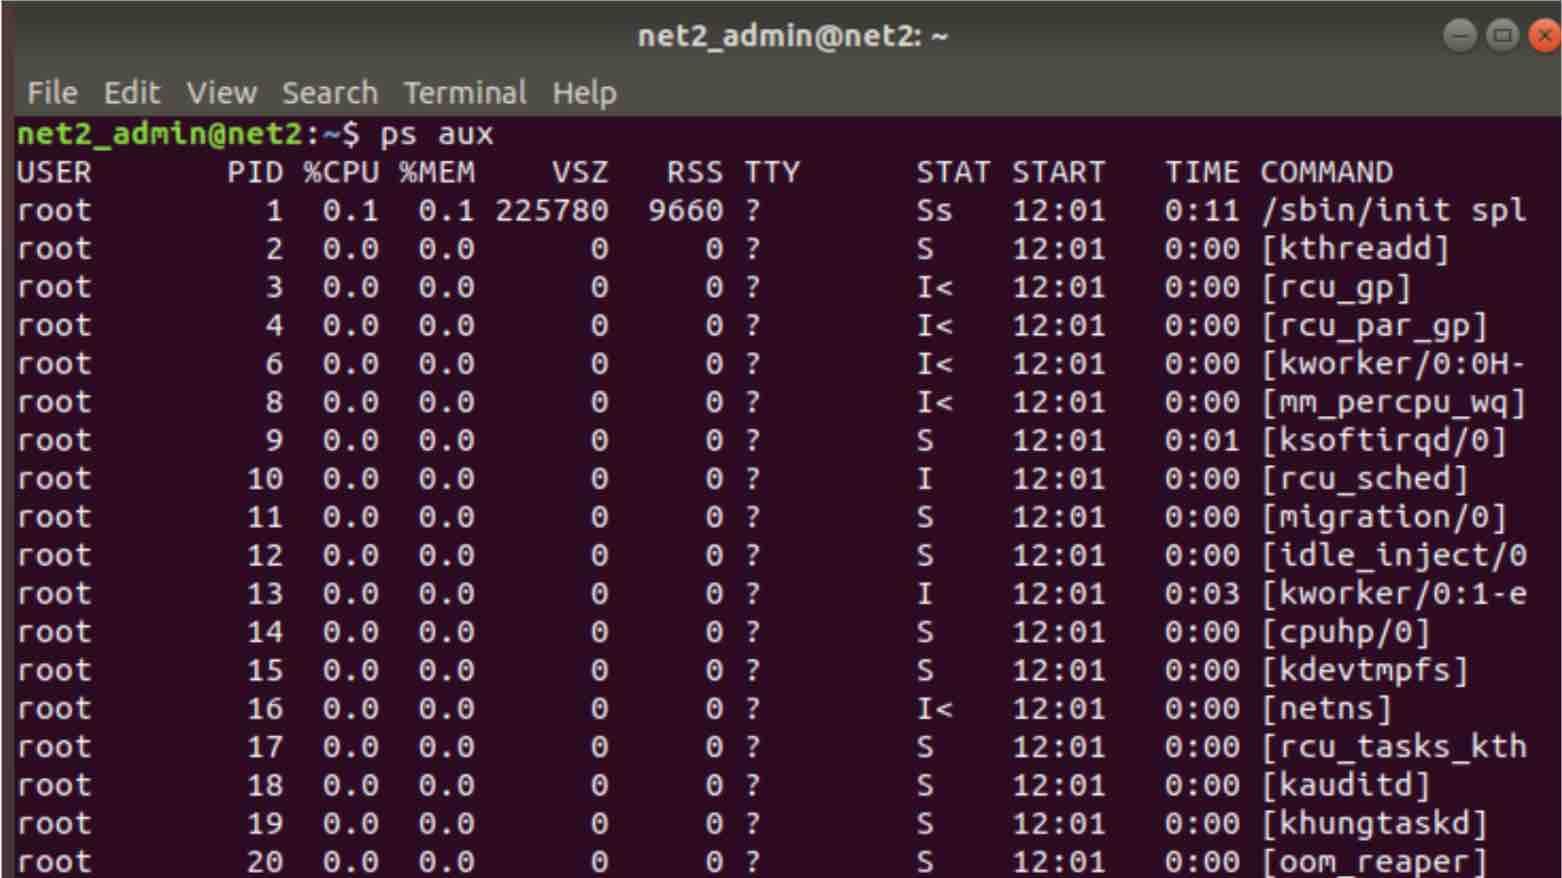
This will display the apps that are using the most memory . They are identifiable by their process IDs.
Vmstat utility
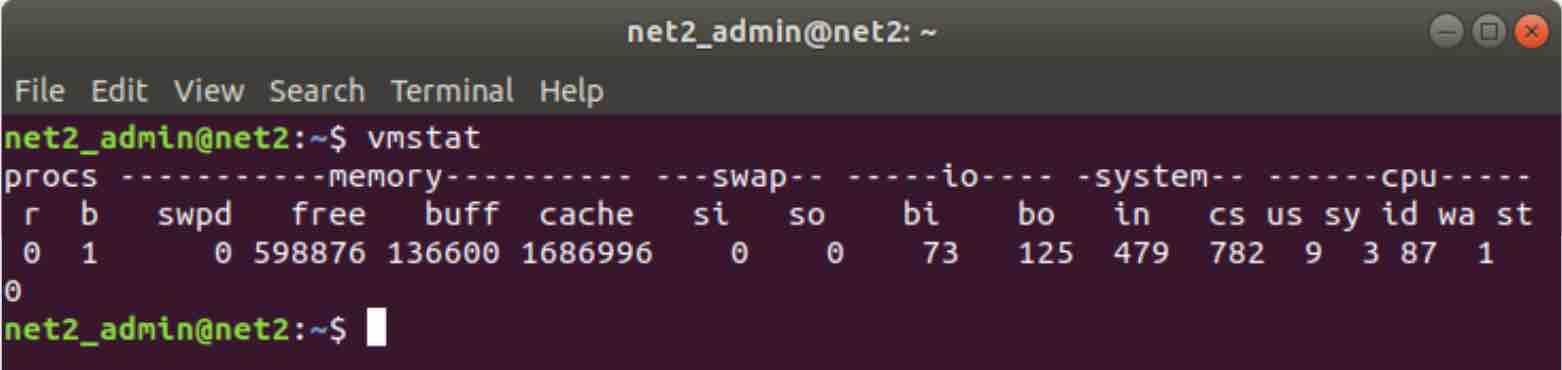
The vmstat command is used to monitor the performance of the system since it yields information about processes, paging, memory, disk, block IO and CPU. The vmstat is also known as reporter of virtual memory statistics .
In your terminal run the following command :
vmstat
It is also possible to have the values shown in one single column, by using vmstat -s :
vmstat -s
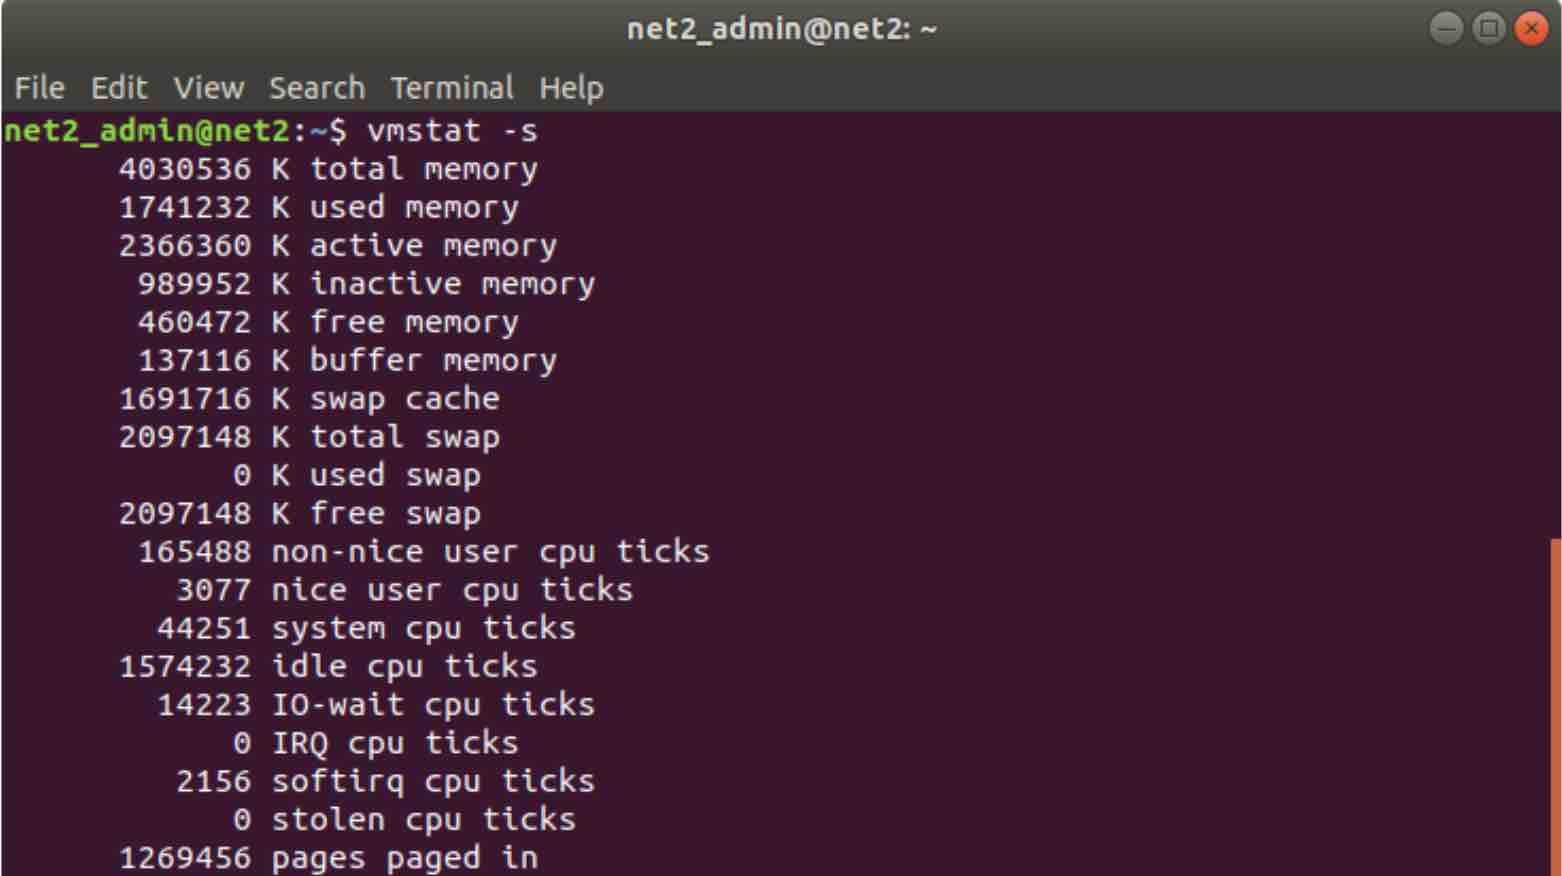
To display the units in megabytes, you should use the -sS M option.

SAR
SAR ( System Activity Report ) collects and reports information about CPU performance, Disk usage, Network monitoring,battery performance , Memory I/O devices consumption and many more. Generated information is provided on the fly and can output it in a file as well using the -o filename switch.
To use SAR, you would have to install it using the command:
sudo apt install sysstat
As soon as this is done, you would have to allow data collection. This is achieved by marking ENABLED=”true” in /etc/default/sysstat in Ubuntu for example.
Fixing high memory usage
One of the common applications that can cause high memory usage on Linux is Java. If you have been using the Java runtime environment, it might give rise to some unexpected issues. If this has been running on a server, JBoss or Tomcat can be the culprits here. Their configuration files can be found in the following :
/usr/local/tomcat/bin/setenv.sh
Other suspects can be MySQL or Apache. You can check the log files for potential warnings or even errors from these very services.
For example to look up an ‘out of memory’ error, you can use the grep command to search the timestamp at which this problem first occurred in the log files of your servers like Apache,Tomcat, MySQL etc.
For an http server for instance, you can also use the grep tool to investigate the access logs in order to check if there are any suspicious or abusive access to the server which might have caused a resource exhaustion attack :
grep -ir “21/Aug/2019:11:02” /usr/local/apache/domlogs/
The following suspicious activities which can be identified from the access logs are
- High access from one single IP addresses
- High access to resources or files which are unavailable.
- High incoming number of requests such as HTTP POST.
- High number of login requests or failed access attempts.
Memory Overcommit
Linux usually affords additional memory for a given process than what it actually requires.
In Linux, overcommitting means giving out virtual memory to processes with no guarantee that the RAM or the physical storage for it exists. It is possible to manually configure the way Linux handles the overcommit feature.
There are two parameters involved in this overcommit configuration :
- proc/sys/vm/overcommit_memory
- /proc/sys/vm/overcommit_ratio
/proc/sys/vm/overcommit_memory
Three different settings are available here:
0: (this is the default) The Linux kernel can overcommit memory freely at any time, an algorithm checks if enough memory is available.
1: Memory overcommit will always be done by the Linux kernel. There is no on memory availability. Though it improves memory intensive workloads, it increases the risk of ‘out of memory’ situations.
2: Memory overcommit will not be carried out by the Linux kernel. Memory allocation is configured by overcommit_ratio.
Make sure you are logged in as a superuser before executing the command below :
echo 2 > /proc/sys/vm/overcommit_memory
/proc/sys/vm/overcommit_ratio
This setting is only accounted for when overcommit_memory = 2. This indicates how much physical RAM is used. Swap space goes on top of that. The default value is “50” or 50%..
As superuser run the command below :
echo 75 > /proc/sys/vm/overcommit_ratio
If you like the content, we would appreciate your support by buying us a coffee. Thank you so much for your visit and support.