Updated on 7/1/2023 – In most Linux distributions, system administrators regularly monitor log files in production environments to assess the system’s health, the status of applications, potential memory issues, high-priority events, and more. This helps them improve overall system performance and proactively prevent future problems that might affect users and their applications. Viewing and analyzing log files can be challenging without the use of appropriate tools and utilities. In this article, we will review some of the best log monitoring tools and log management applications currently in use.
Read: What you need to do to secure Ubuntu
Logcheck
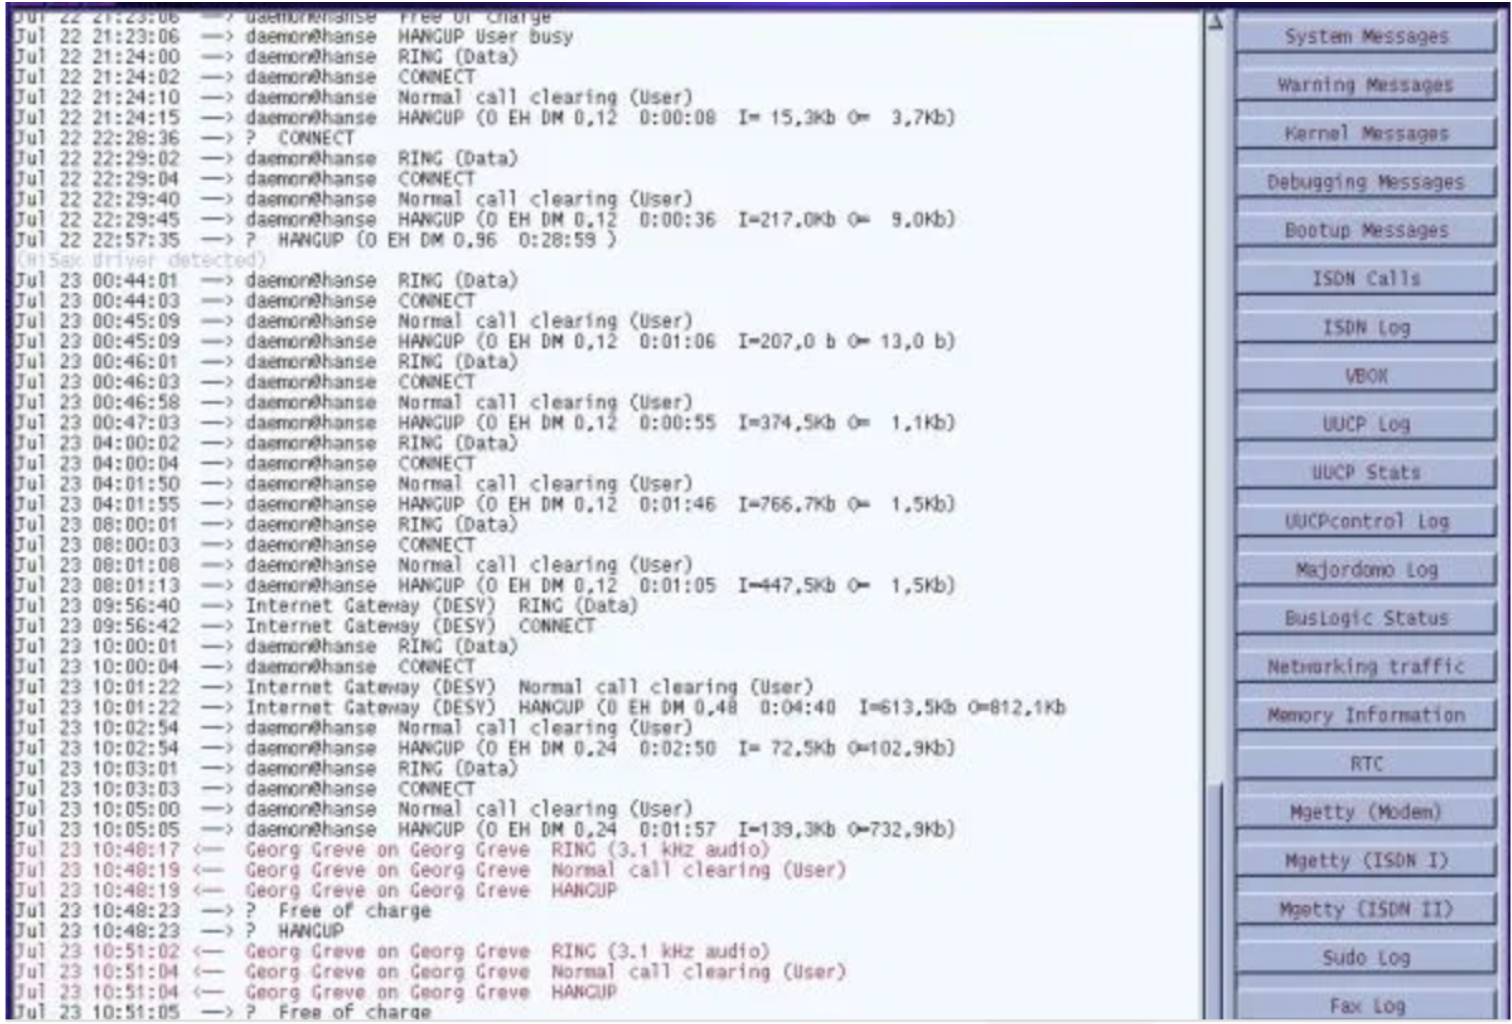
Logcheck is a widely used open-source log management utility that can automatically identify unknown issues and security breach-related events in log files. It filters out unnecessary entries and sends the findings by email on a regular basis. An example email is shown below:
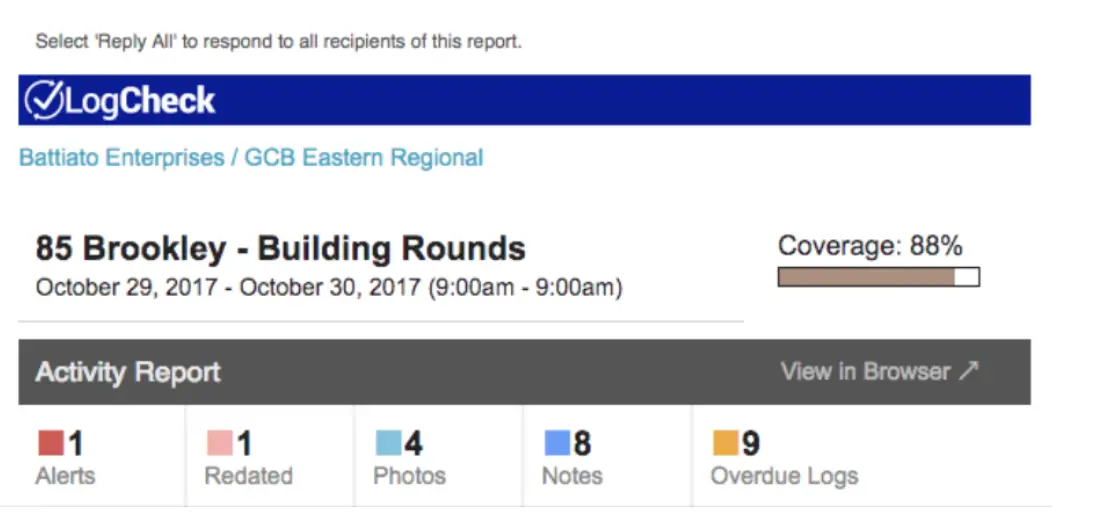
Log file monitoring example
It runs by default every hour as a cronjob and after every bootup. It has three different logfile filtering levels:
Paranoid: is meant for high-security systems.
Server: is the default filtering level
Workstation: is meant for sheltered systems. This includes rules specified under server and paranoid levels.
Logcheck can sort reported messages into three categories: Security events, system events and system attack alerts and has the following features :
- Has predefined templates for reports
- Easy log filtering mechanism with regular expressions
- Instant email notifications
- Has cloud based dispatch handling system
- Instant security issues alerts
find out more about Logcheck here.
Read: Guide to Linux Ubuntu/Debian log files for beginners
Logstash
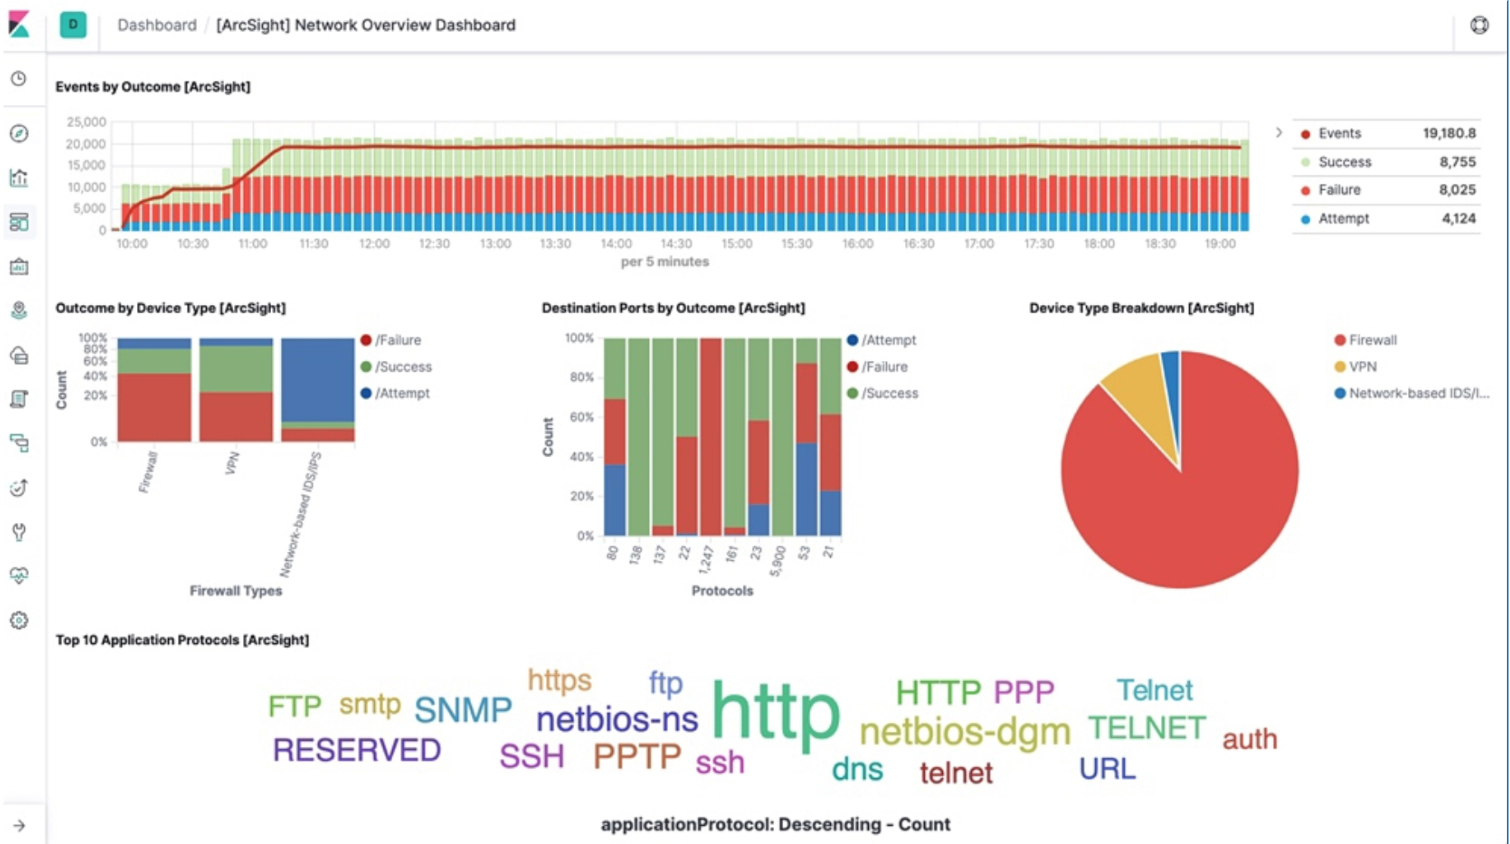
Logstash is an open-source data processing and logging system that can process, collect, and forward events and system log messages. It is capable of quickly reading and loading large amounts of unstructured data. Logstash includes predefined filters that assist with data indexing and transformation. It is able to unify and ingest data from various log sources, including web applications, metrics, various AWS services, and data stores, enabling system administrators to compare, cleanse, analyze, and visualize their log data.
Logstash has the following features :
- Has a flexible plugin architecture
- Can handle any data source independently of its shape and size
- Integration with Elasticsearch, Kibana and Beats
- Easy orchestration and management of pipelines
- Seamless integration with the built-in security features
- Derive structure out of unstructured data
Visit Logstash website here.
Splunk
Splunk is a fully integrated, robust and powerful enterprise log management software. It allows to collect, search , diagnoze, report and store any machine generated log data regardless of its shape, i.e. structured or unstructured, and complexity.
Furthermore, splunk supports various log management tools and use cases such as ;
- Log consolidation and retention
- Security
- IT operations troubleshooting,
- Application troubleshooting
- Compliance reporting.
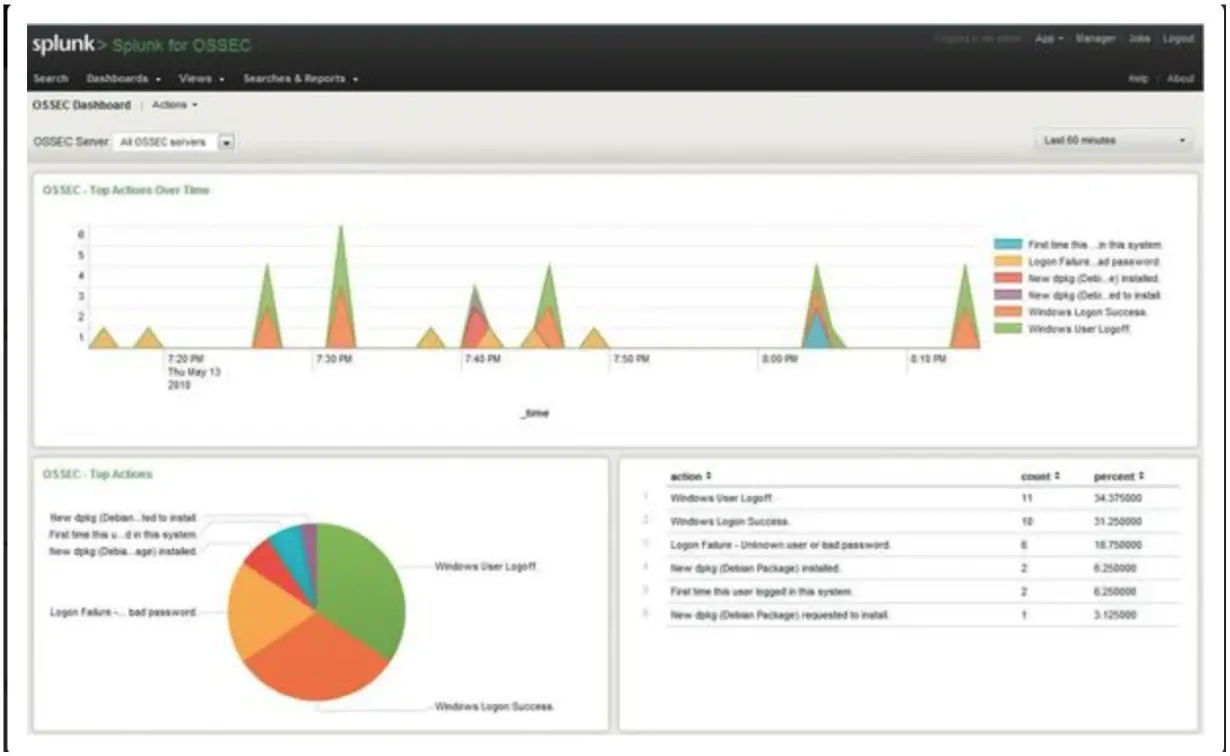
Splunk log monitoring
Splunk has the following features :
- Machine data indexation
- Data monitoring and alerting
- Enables to freely pivot across data
- Flexible access to relational databases, CSV files, enterprise data stores (NoSQL)
- Supports local and remote data sources
- Data searching and correlation
- Fully integrated and easily scalable
Visit Splunk website here.
Graylog 2
Graylog is a powerful, fully integrated open source log management framework that helps system administrators analyze, aggregate, and extract structured and unstructured data from server logs collected with Syslog. It allows users to visualize and search the logs using a rich interface with intuitive diagrams.
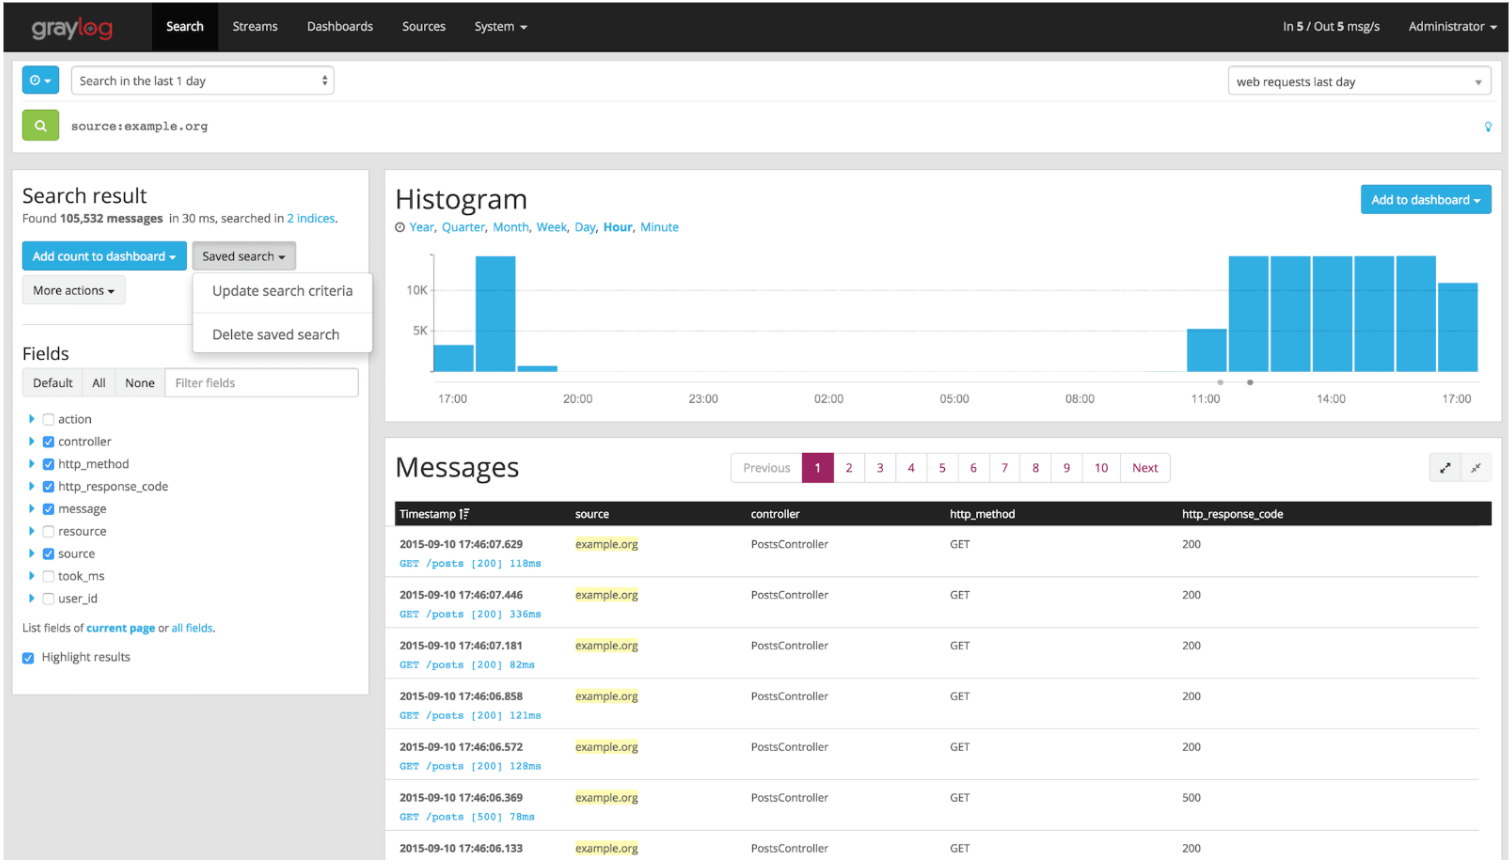
Graylog uses MongoDB in order to store the configuration data and not the log data. Only metadata such as stream configurations or user information, is stored. Here some of feature of Graylog :
- Seamless enterprise level production environments Integration
- Log processing in real time
- Accessible, speedy and secure
- Contains predefined templates for data display
- Provides an operational data hub
- Highly customizable and extensible
- Unstructured data parsing enabling
- Can ingest any structured data from any log source
- Integrated dashboard and alerting system
- Various alert notifications
Visit Graylog website here.
Read: How to use systemd to troubleshoot Linux problems
Xlogmaster
Xlogmaster is a powerful tool that helps system administrators monitor their system by tracking everything that occurs, no matter how many log files or devices are involved. Its user-friendly graphical interface allows users to easily set up a variety of actions and keep track of all aspects of log files. Xlogmaster can be used to adjust the visibility of lines in log files and initiate scripts through triggers.
It has the following features:
- Runs status gathering programs
- It enables data translation and display with filters
- Highly configurable interface
- Keyboard accelerators
- Logfile rotation catching
- Supports a system wide entry database
You can visit xLogmaster here.
Lnav
Lnav is an advanced log file viewer aimed at the small-scale Linux environments. It helps systems administrators watch and their log files from within the terminal. It is very easy to setup since it requires no server and no complex pre-configuration.
Lnav has the following features :
- Watch and analyze log files from a terminal.
- Seamless Log file directory scanning
- Automatic detection of file formats
- Unpacking compressed files on the fly
- Help highlight the important log parts
- Filter out the noise in the log
You can find out more about Lnav here.
Read: Glances an excellent tool for Linux monitoring
Logwatch
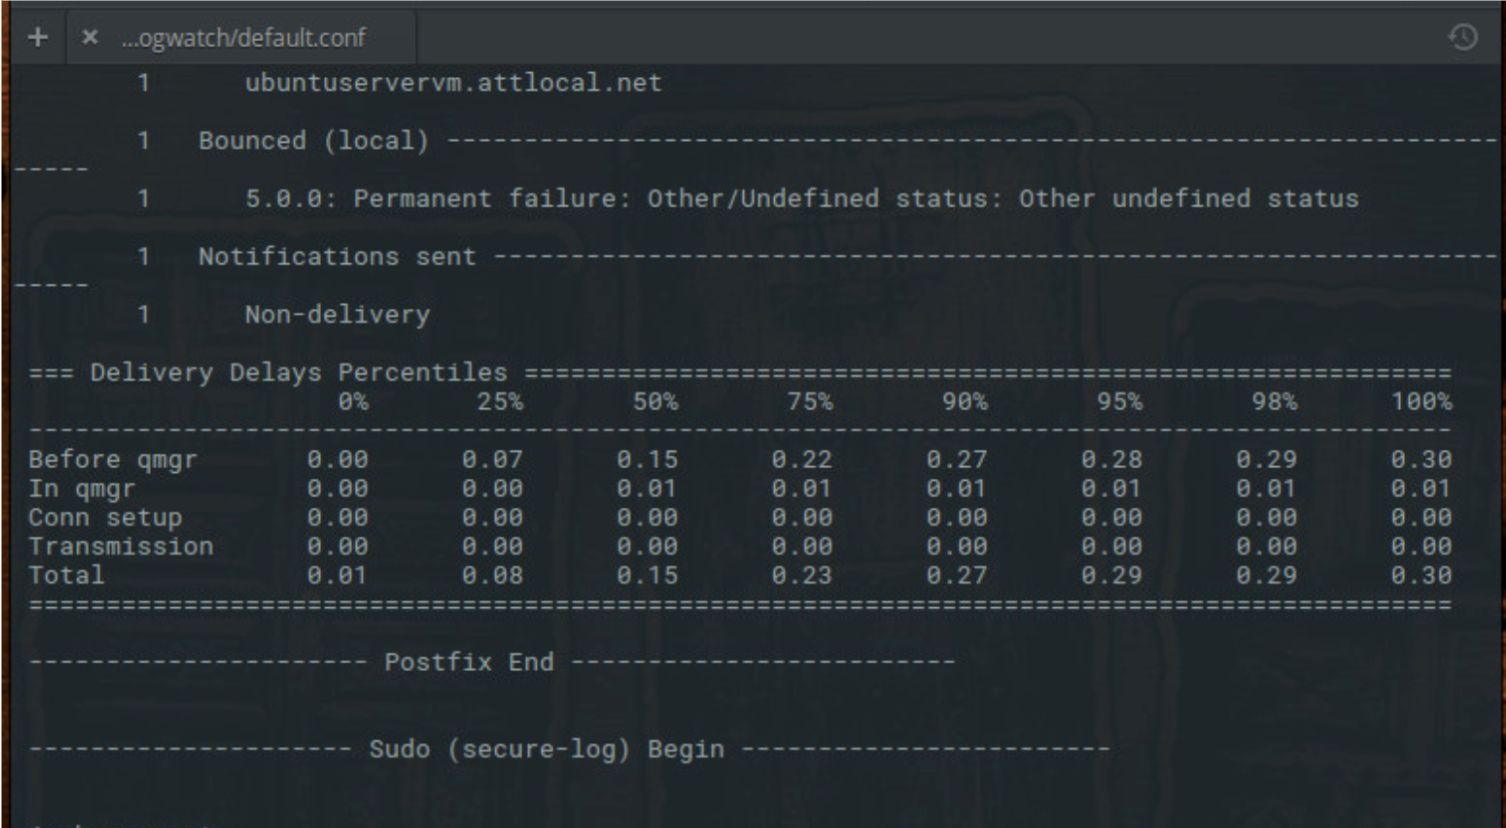
Logwatch is a versatile and powerful log analysis tool that enables system administrators to receive a single report with summarized logs from various systems. It allows users to create custom scripts and add plugins, and generates periodic reports based on user-defined criteria. Logwatch can scan log files and present the data in a format that is easily understandable to humans.
- It offers a full report that contains all the actions that occurred on a server
- Easy to use for regular users and system administrators
- Instant alert messaging
- Customizable dashboard
- Powerful search capabilities
- Smart filtering system
- Security breach and threat detection and analysis
Visit the homepage of Logwatch.
Nagios
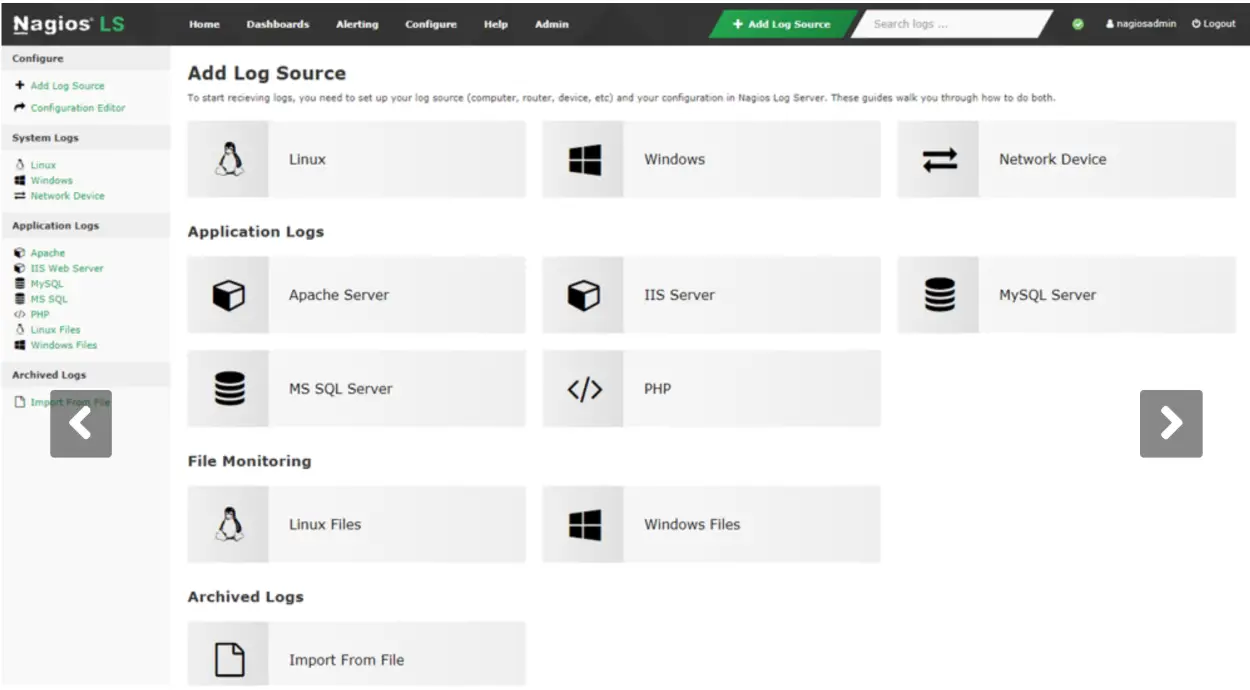
Nagios is a comprehensive log management and monitoring tool that allows for the centralized monitoring of system logs, application logs, event logs, and syslog data. In the event of a potential threat, Nagios sends alerts to notify all relevant parties and provides them with the ability to quickly access and analyze the corresponding log data to resolve the issue. Nagios also allows for real-time viewing of log data, enabling system administrators to efficiently address and analyze problems as they arise.
Here are some features of Nagios :
- Increased security
- Increased services, application and server availability
- Fast detection of protocol failures and network outages
- Historical archiving of all events
- Fast detection of failed processes, cron jobs, services, and batch jobs
- Audit compliance
- Regulatory compliance
Visit Nagios website here.
GoAccess
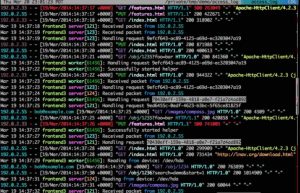
GoAccess is an interactive open source log analyzer that runs in a terminal or in a browser, i.e. web based . It provides real time quick analysis and overview of web server statistics. it it is able to generate a self-contained, complete real-time HTML report (great for monitoring, analytics and data visualization).
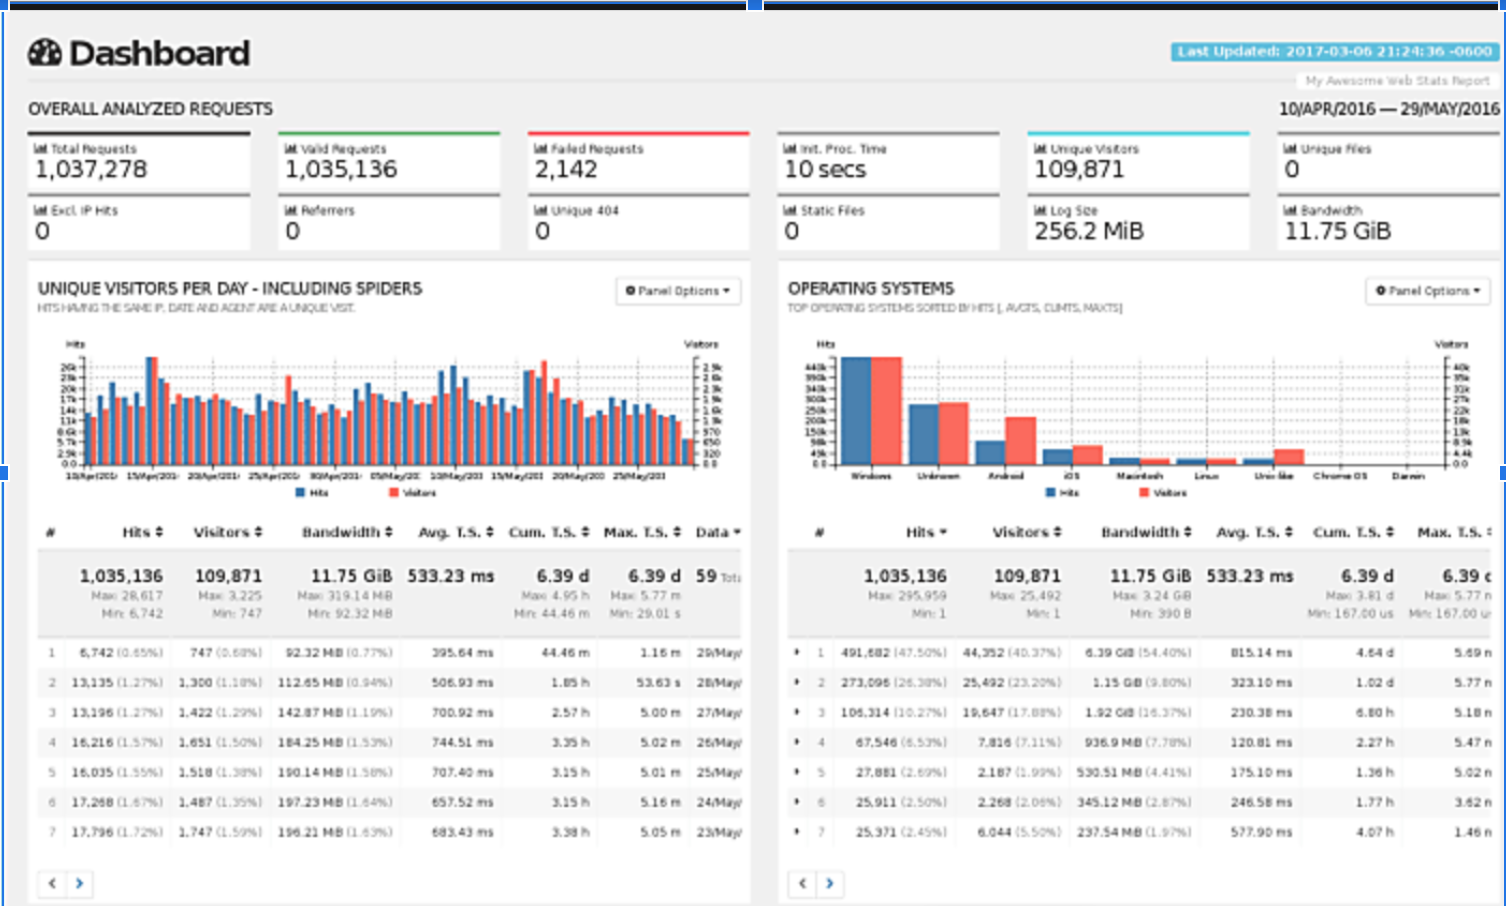
Its main features are :
- Offers systems administrators HTTP statistics report on the fly
- Real-time, fast, millisecond updates
- Most web log formats are supported (Nginx, Apache, Elastic Load Balancing, Amazon S3 ,CloudFront, etc)
- Beautiful bootstrap and terminal dashboards
Visit GoAccess here.
Journalctl
journalctl is a command line tool that enables users to view log messages from the system journal. When no specific parameters or switches are provided, it will display the entire system journal in a pager (using less by default). However, options and filters can be used to modify the output. Options allow users to control the number of lines displayed, enable “follow” mode, change the displayed field, specify a time range, and more. Filters, on the other hand, can be used to control the display of information about services and units.
You can find out more about journalctl in our detailed article here.
LOGalyze
LOGalyze is an open source log management and network monitoring tool that is designed to centralize log data from a variety of devices, including network devices, Linux/Unix servers, and Windows hosts. It offers real-time event detection, advanced search capabilities, and the ability to classify logs by source host, severity, and type, as well as split them into different fields for storage and future analysis. System administrators can use LOGalyze to collect and analyze log data, define alerts and events, and correlate log data from any device.
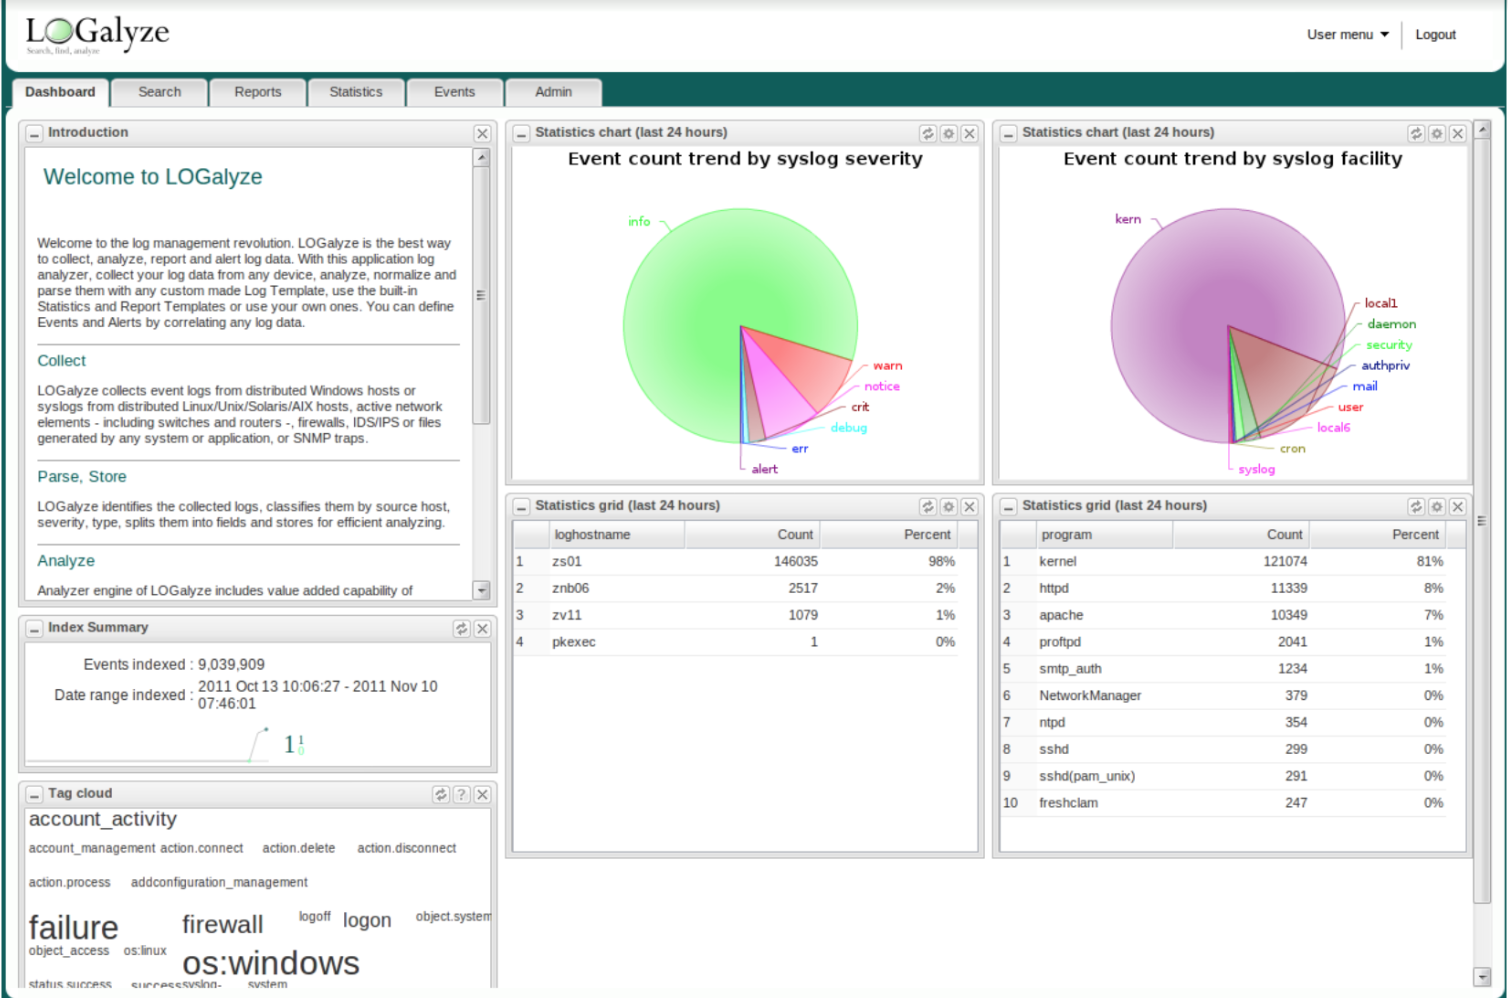
LOGalyze has the following features :
- Offers real-time correlated event detection and multi-dimensional statistics
- Straightforward incident review capabilities and management
- Provides plug-in style Alert modules which notifies other parties when an event is triggered
- Provides a web-based customizable user interface
You can visit LOGalyze website here.
KSystemLog
KSystemLog displays all log files content of your system, grouped by General services ( Authentication, Default system log, Kernel, X.org…), and optional Services ( Cups, Apache etc, …).
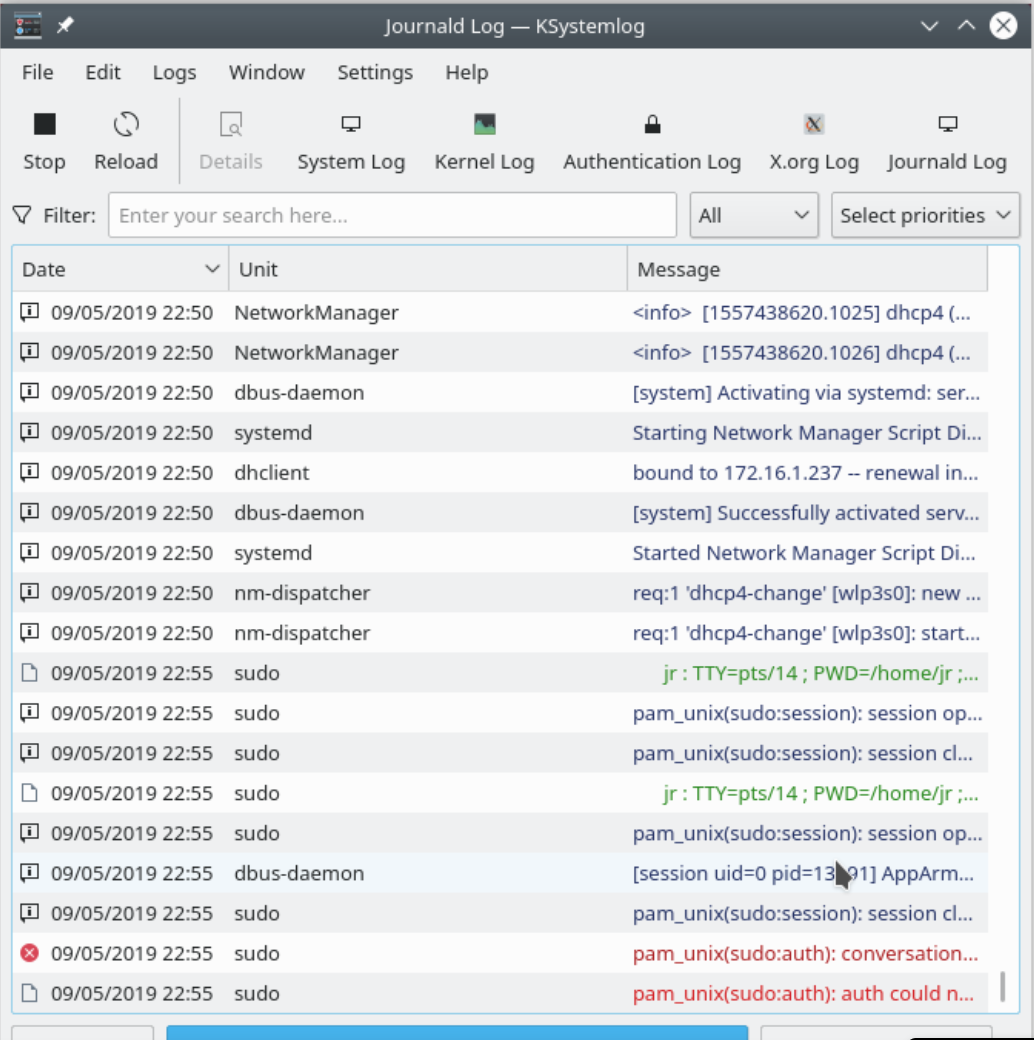
It has many features that help to read your log files :
- Log lines marking severity wise
- Simultaneous display of several logs using tabbed views
- Real time log display
- Provides detailed log lines information
You can find out more about KSystemLog here.
Conclusion
In this article, we have introduced several open source log management tools that are available for use. Whether you are a casual user or a system administrator, these tools can be used to manage log data and improve system performance. We will continue to update this article with additional log management applications in the future. If you are aware of any other tools that we have not mentioned, please leave a comment to let us know so we can include them in our list.
If you like the content, we would appreciate your support by buying us a coffee. Thank you so much for your visit and support.