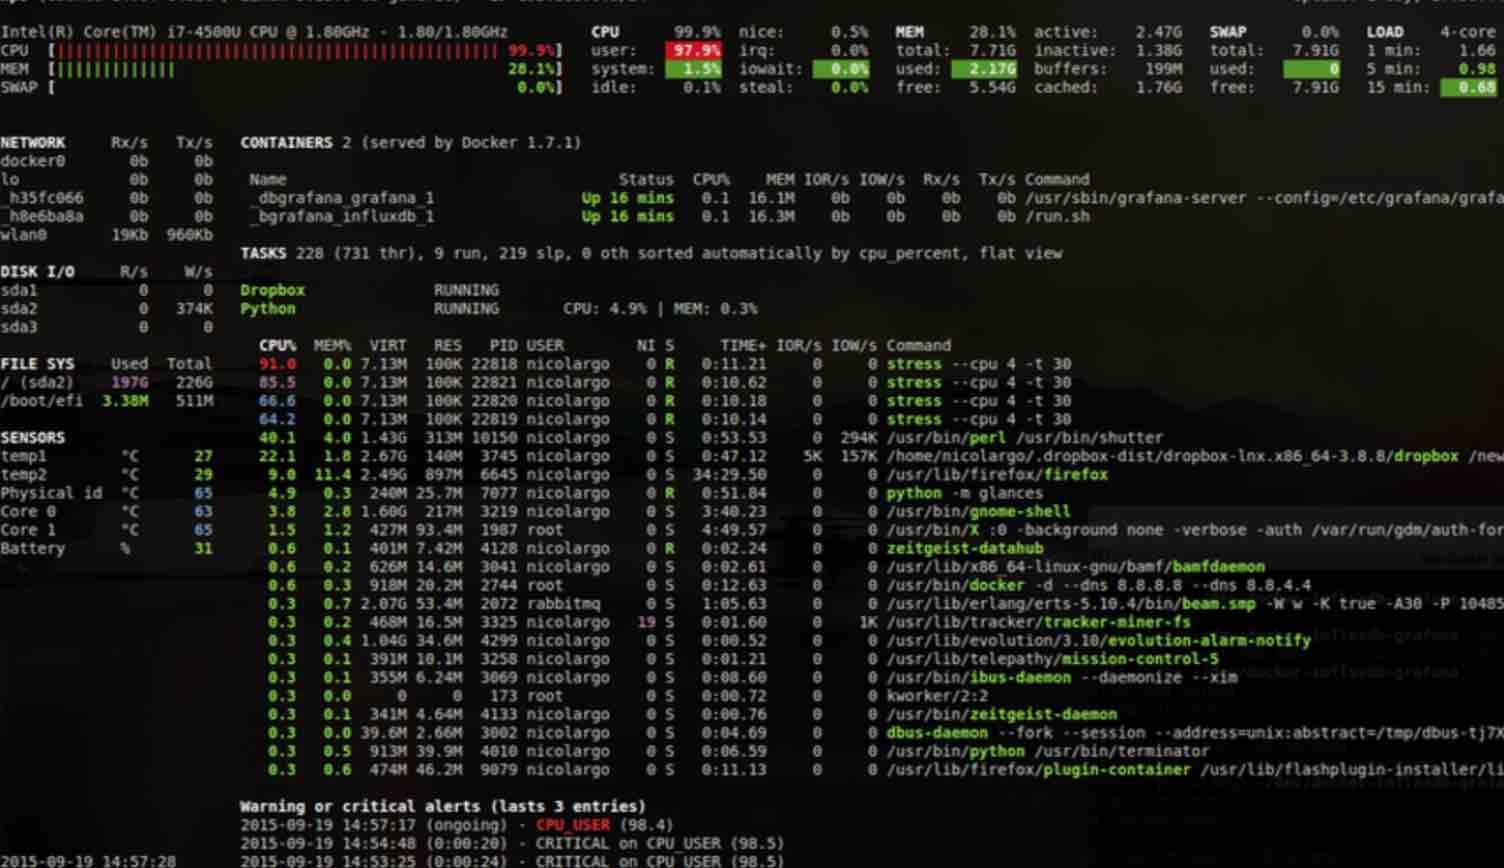
Glances, is a command-line utility, written in Python , used to monitor the CPU, average load, memory, network interfaces, I / O disk, processor and system of files.
Glances uses the psutil library to obtain system information, in addition to offering the ability to use the utility in client / server mode for remote monitoring.

Glances which offers an intuitive and attractive web interface, is quite similar to Nmon in that it has a very compact screen which provides a complete overview of the different system resources in a single screen area. It does not support any complex functionality, but only provides a brief overview.
Glances displays the following information:
- Memory information including RAM, swap, and free memory.
- The average CPU load.
- CPU information, such as user-related applications, system programs, and idle programs.
- Total number of active and dormant processes.
- Download and upload rates for your network connections.
- Disk I / O to read and write details.
- Shows currently mounted disk devices.
- Shows the current date and time at the bottom.
- How to install Glances in Linux?
For those who are interested in installing this utility on their systems, they can do so by following the instructions below.
Read: Linux Ubuntu/Debian monitoring tools guide for system administrators
Installing glances
Those who are users of Debian, Ubuntu and similar distributions, can install Glances from the repositories of their distro.
To do this, simply open a terminal on your system and type the following command in it:
sudo apt-get install glances
Now for those who are users of RHEL, CentOS, Fedora and some other distribution derived from these, the installation can be done with any of the following commands:
sudo yum install glances
OR
sudo dnf install glances
While for those who are users of Arch Linux, Manjaro, Arco Linux or some other distro based on Arch Linux , the installation is done with the following command:
sudo pacman -S glances
To install using an auto install script, you can view the commands here.
Using glances
After installing to start using the utility, simply run the command:
glances
Glances, has quick access keys , which are:
- m: Sort processes by MEM%
- p: Sort processes by name
- c: Sort processes by CPU%
- d: Show / hide disk I / O statistics
- a: Sort processes automatically
- f: Show / hide file system statistics
- i: Sort processes by I / O rate
- s: Show / hide sensor statistics
- y: Show / hide hddtemp statistics
- l: Show / hide records
- n: Show / hide network statistics
- x: delete critical logs and warnings
- h: Show / hide help screen
- q: Exit
- w: Delete warning records
It also has color codes:
Green: ok
Blue: caution
Violet: Warning
Red: critical
And by default, the Glances thresholds are set to:
Caution: 50
Warning: 70
Crit: 90
Finally, if you want to know more about it and consult its documentation, you can go to the following link.
If you like the content, we would appreciate your support by buying us a coffee. Thank you so much for your visit and support.
