Have you ever been in a situation where you need to install some cool new software on your Linux machine, but first, you need to double-check its details?
Maybe you need the system architecture, specific device info, the OS version, or even hardware specs to ensure everything will play nice together.
The great news is that Linux comes equipped with a bunch of free, built-in utilities that make finding Linux system information a breeze.
In this walkthrough, I’ll share some of the tools I find most useful, covering both command-line and graphical options. My goal is to help you get comfortable grabbing this info whenever you need it. Let’s get started!
Using the `uname` Command: Quick System Details (Kernel, Release, and More)
The `uname` command is a real workhorse in the Linux world. It offers several options (often called switches or flags) that are super handy for quickly pulling up basic details about your system’s core components.
Finding the Linux Kernel Name
Let’s start simple. Open your terminal and just type:
uname
When you run `uname` without any specific options like this, it typically just tells you the kernel name – which is usually “Linux”. This gives the same result as using the `-s` (system name) option:
uname -sChecking the Linux Kernel Release
If you need the exact release number of the kernel your system is running, use the `-r` option:
uname -r
Read: Understanding the basic components of the Linux operating system architecture
Viewing the Linux Kernel Version Details
For more detailed kernel version information, like when it was compiled, the `-v` switch is what you need:
uname -v
Displaying the Network Node Hostname
To see your system’s name on the network (its hostname), use this command:
uname -n
On most Linux systems, you’ll get the same result with the more descriptive option:
uname --nodenameJust a little note: on operating systems other than Linux, the “node name” might not always be identical to the “hostname”.
Read: How to display your sound card details using the terminal on Ubuntu 22.04
Identifying the Machine Hardware Architecture
Want to know if you’re running a 32-bit or 64-bit system? The `-m` (machine) switch reveals the hardware architecture:
uname -m
If you see `x86_64`, that typically means you have a 64-bit architecture. If you’d like a deeper dive into figuring out whether your OS installation is 32-bit or 64-bit, check out our article here.
Finding the Processor Type
To get information about your processor type, you can use the `-p` option:
uname -p
This output, like `x86_64`, often indicates a 64-bit processor. However, be aware that this command might sometimes return ‘unknown’ as its output isn’t always universally supported or definitive across all hardware/kernels.
Checking the Hardware Platform
Similarly, you can try to get the hardware platform information using the `-i` flag:
uname -i
Like the `-p` option, the information from `-i` might also sometimes be ‘unknown’ or just reflect the architecture (e.g., `x86_64`).
Displaying the Operating System
To simply print the name of the operating system, use the `-o` option:
uname -o
Read: Maximize Ubuntu 24.04 Speed and Efficiency: A Complete Tuning Guide
Getting All System Information at Once
Tired of running separate commands? The `-a` (all) option is your friend! It conveniently combines most of the useful information from the flags we just discussed into a single line:
uname -a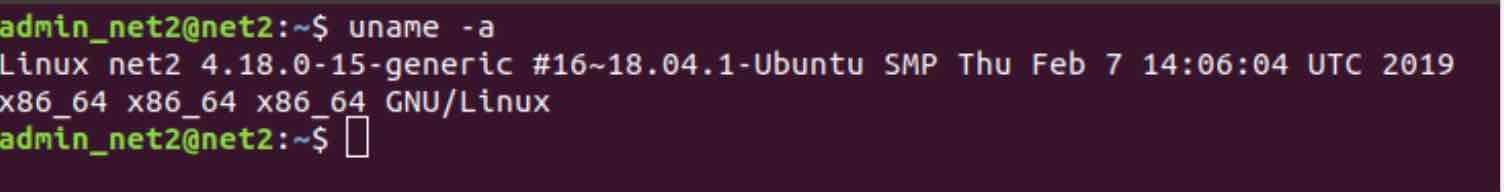
A concise overview of Linux system info using `uname -a`.
As you can see, this gives a detailed snapshot. Let’s break down what each piece typically represents based on the example image:
| Field Description | Example Value | Corresponding `uname` Option |
|---|---|---|
| Kernel Name | Linux | `-s` |
| Network Node Hostname | ubuntulab | `-n` |
| Kernel Release | 5.0.0-37-generic | `-r` |
| Kernel Version Details | #40~18.04.1-Ubuntu SMP Thu Nov 14 12:06:39 UTC 2019 | `-v` |
| Machine Hardware Architecture | x86_64 | `-m` |
| Processor Type (often indicative) | x86_64 | `-p` (may vary) |
| Hardware Platform (often indicative) | x86_64 | `-i` (may vary) |
| Operating System | GNU/Linux | `-o` |
Using `lshw`: The Detailed Linux Hardware Specification Tool
When you need to go beyond the basics and get a really deep look at your computer’s hardware, `lshw` (List Hardware) is an incredibly powerful command. It meticulously scans system files (especially within the `/proc` directory) to gather and present detailed hardware specifications.
One important thing: `lshw` usually requires administrator privileges (use `sudo`) to access all the nitty-gritty hardware details it needs. It’s capable of showing things like your motherboard configuration, RAM setup (including slots), firmware versions, CPU info, cache details, bus speeds, and much more. The good news? It’s often installed by default on many popular Linux distributions.
Running `lshw` by itself produces a very comprehensive (and often lengthy!) report:
sudo lshw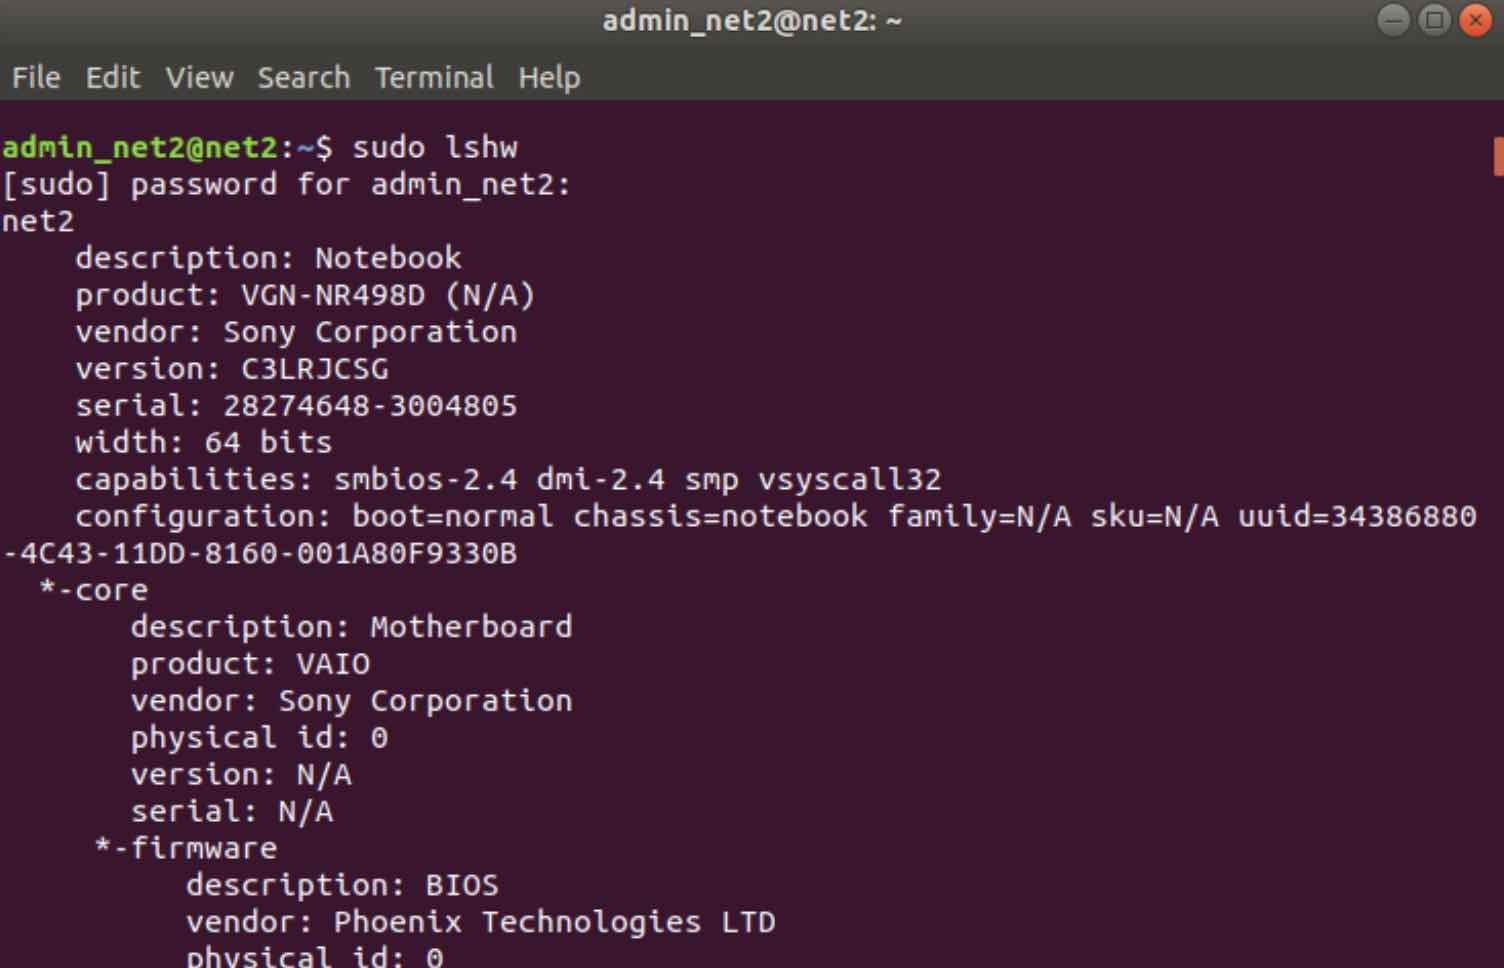
Read: 12 Linux Basic Health Check Commands for Monitoring Performance
Getting a Concise Hardware Information Summary
If the full output feels like too much information, the `-short` option provides a much more digestible summary, listing hardware components by class:
sudo lshw -short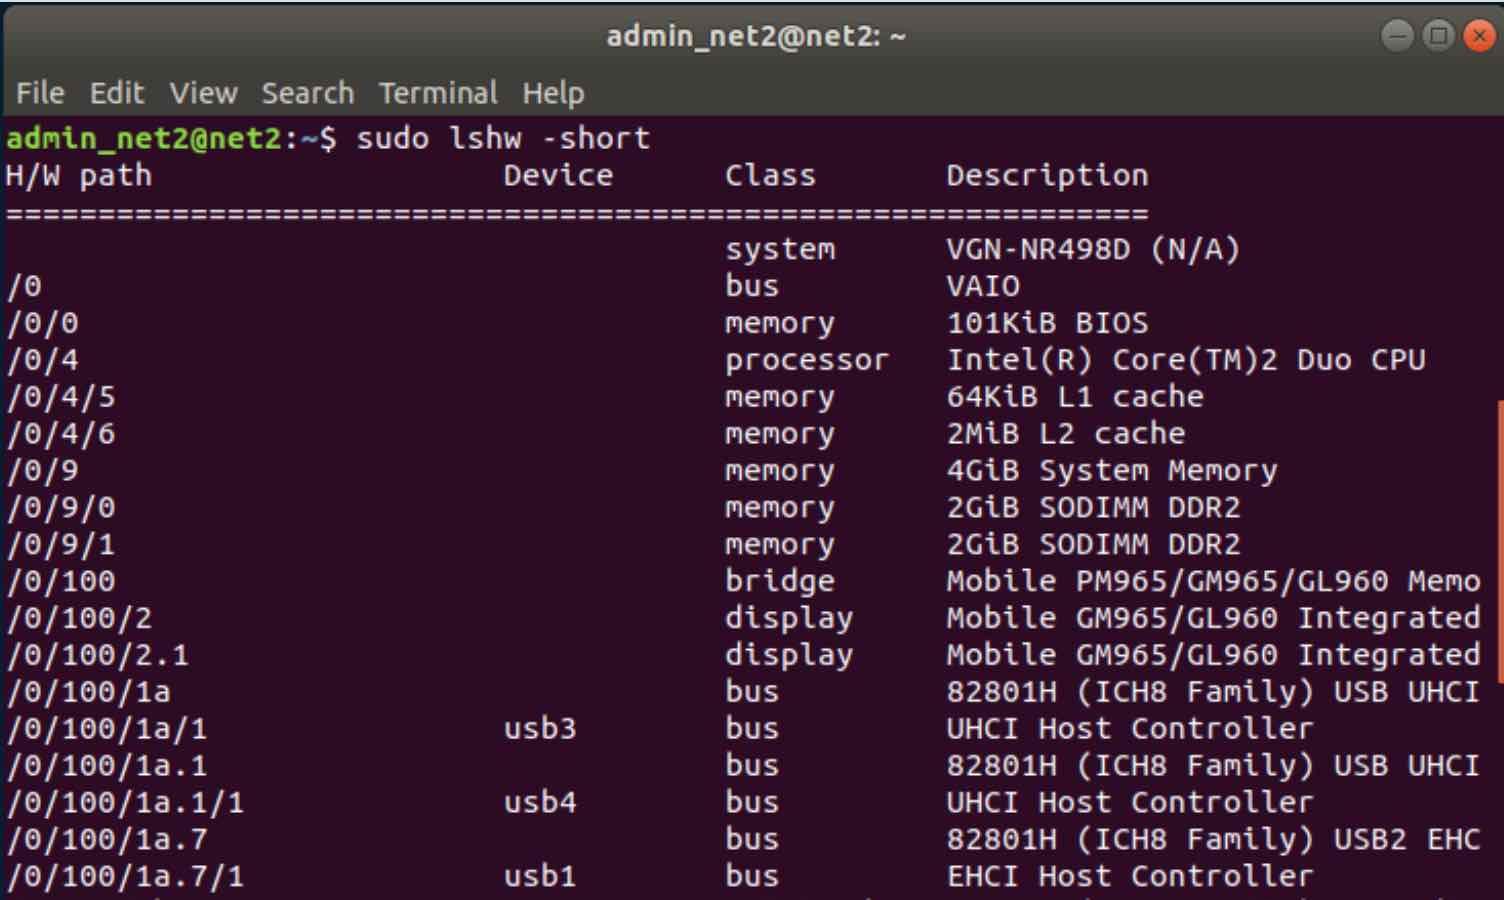
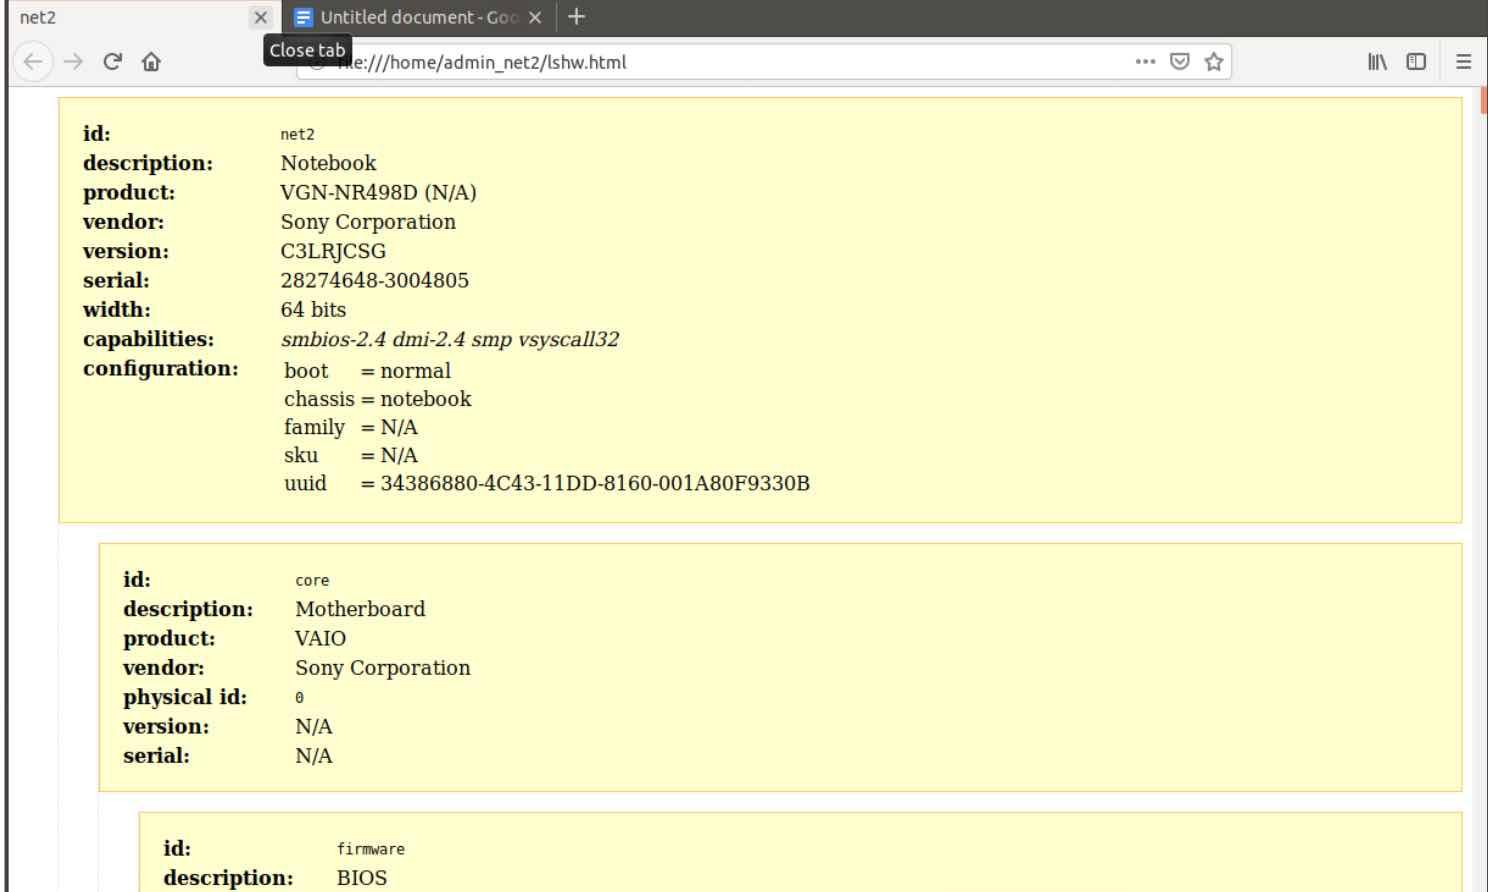
Exporting Hardware Data to an HTML Report
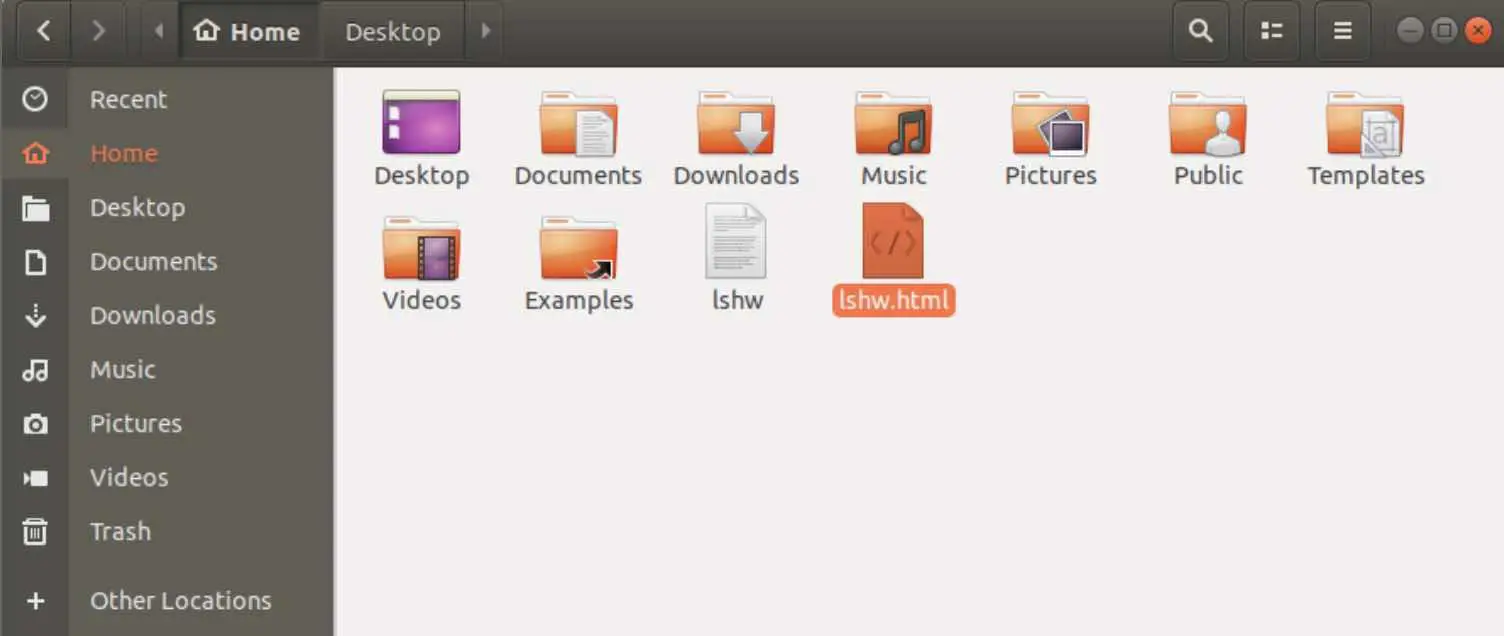
Need to share your system’s hardware specs, maybe for a support ticket or documentation? `lshw` makes this easy by allowing you to output the full details into a nicely formatted HTML file. Here’s how you can do it:
sudo lshw -html > my_hardware_report.html![]()
After running that command, you’ll find a file named `my_hardware_report.html` (or whatever name you chose) in your current directory. You can open this file right in your web browser:
Focusing on Specific Hardware: Network Devices Example
Since `lshw` provides a mountain of data, you’ll often want to zero in on a specific type of hardware. The `-c` option lets you specify a hardware class (like `network`, `display`, `memory`, `storage`, `processor`, etc.). For instance, to view details only about your network interfaces, run:
sudo lshw -c network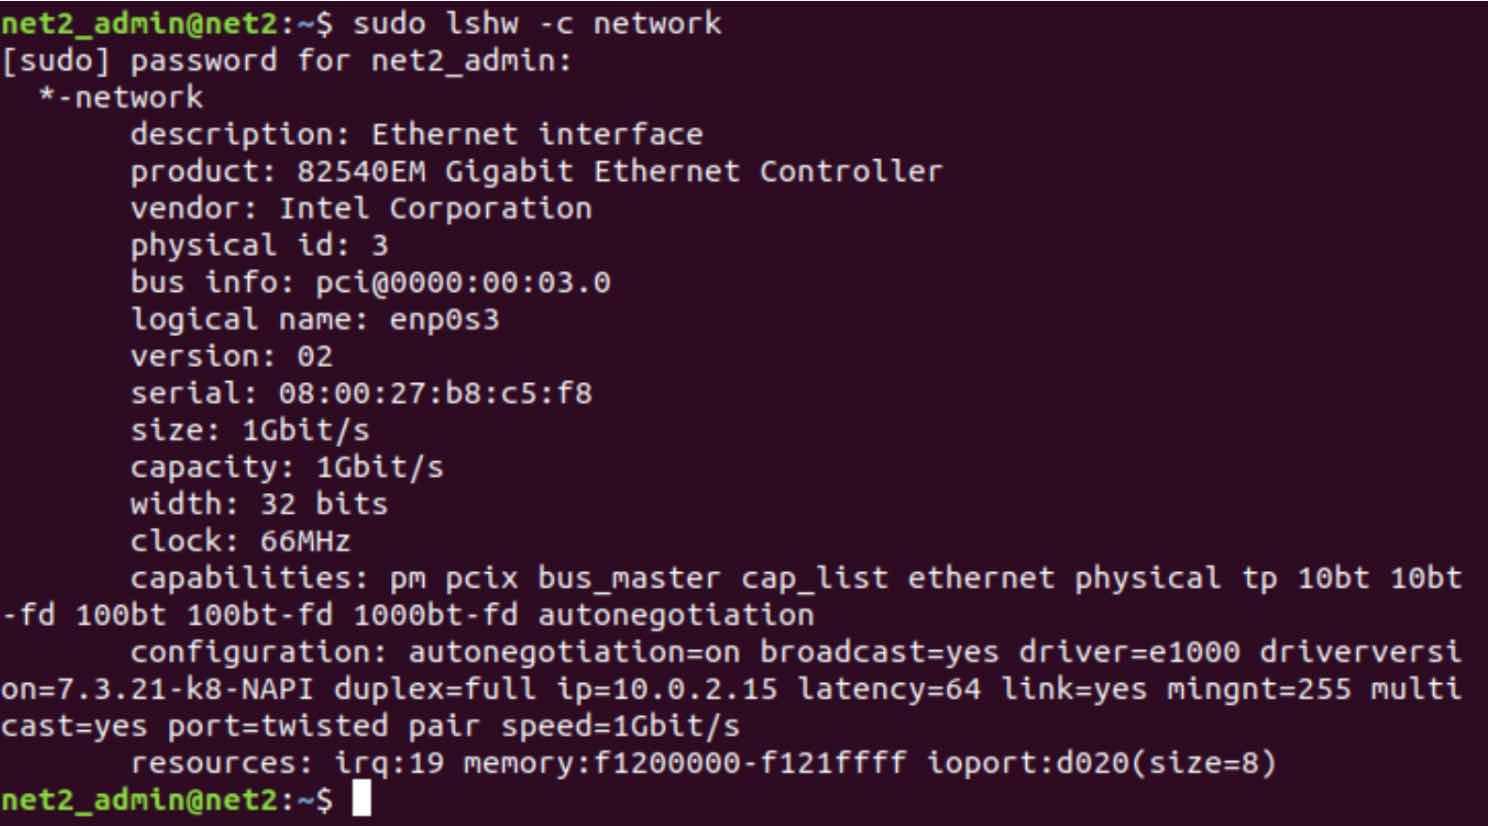
Read: How to resolve WiFi Issues on Ubuntu 24.04
Using `lscpu`: Get CPU Information in the Linux Terminal
When your main interest is the Central Processing Unit (CPU), the `lscpu` command is the perfect tool for the job. It pulls information mainly from `/proc/cpuinfo` and the `sysfs` virtual filesystem, presenting it in a clear, human-readable format.
lscpu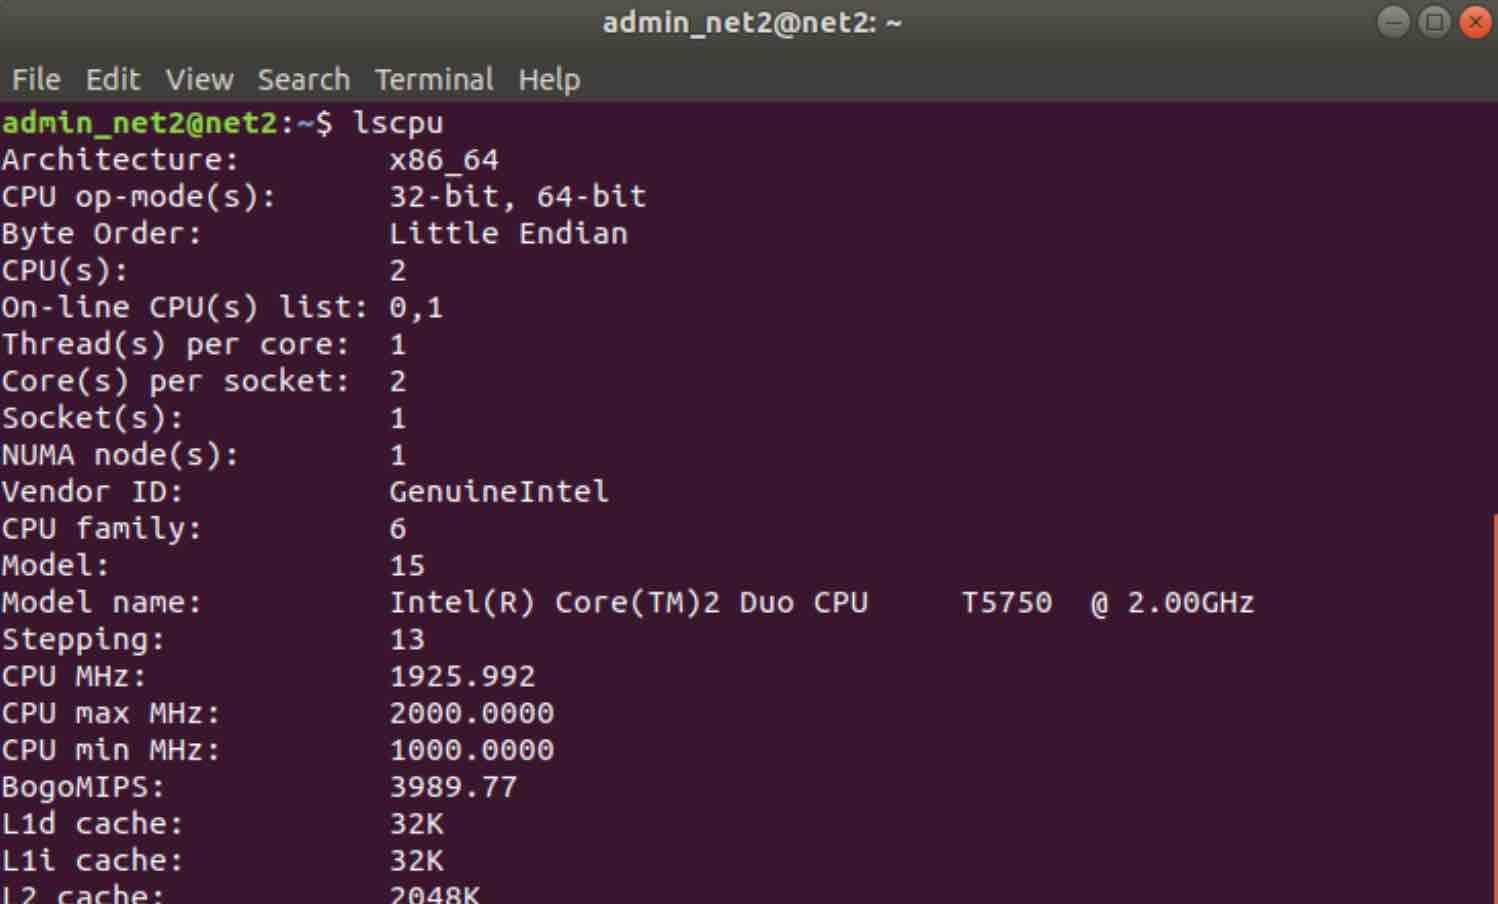
This command quickly gives you key CPU details: Architecture (e.g., x86_64), Vendor ID, Model name, number of CPUs (sockets), cores per socket, threads per core, L1/L2/L3 cache sizes, and more. It’s incredibly useful for understanding your processor’s capabilities at a glance.
Read: How to save power on Linux Ubuntu/Debian using cpufreq
Using `lsblk`: Listing Hard Drives and Partitions in Linux
Need a quick overview of the storage attached to your system? The `lsblk` (List Block Devices) command excels at this. It shows your hard drives, SSDs, their partitions, and any connected removable media like USB drives, all in a neat tree structure.
lsblk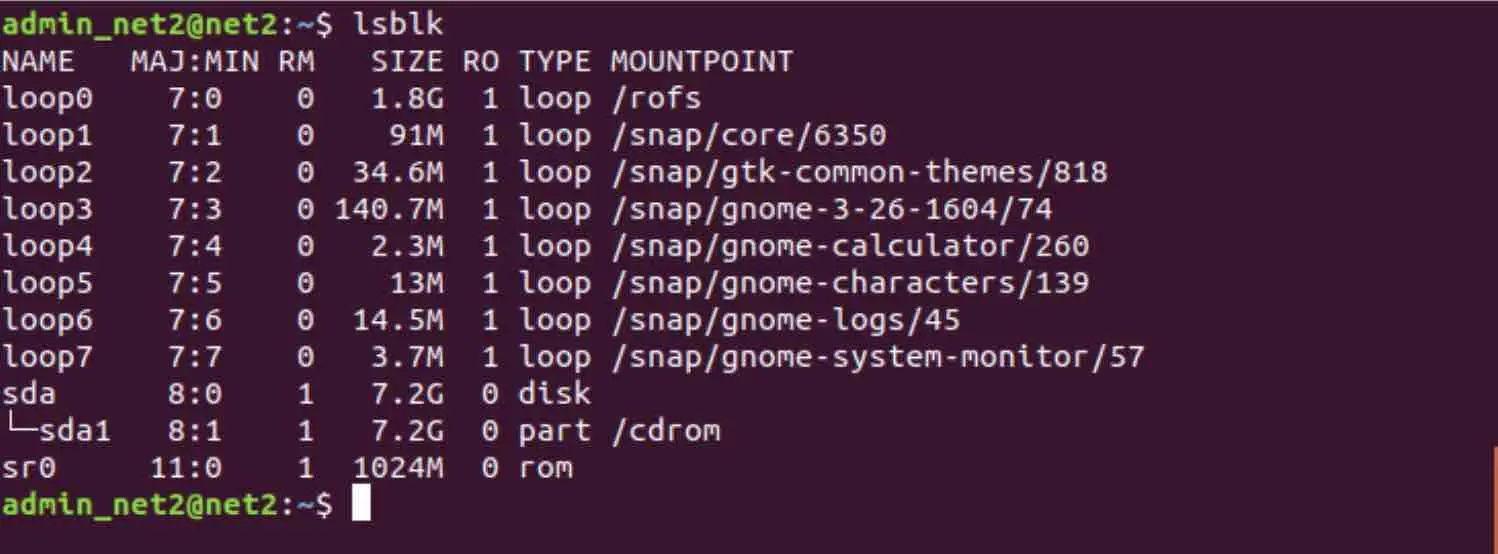
You can easily see device names (like `sda`, `nvme0n1`), their sizes, types (disk, part), and where they are mounted in the filesystem (if applicable).
Using `lsusb`: How to See Connected USB Devices in Linux
Wondering what USB devices are currently plugged into your machine? The `lsusb` command provides a list of all USB controllers (hubs) and the devices connected to them. It’s great for identifying things like your keyboard, mouse, webcam, external hard drive, or USB flash drives.
lsusb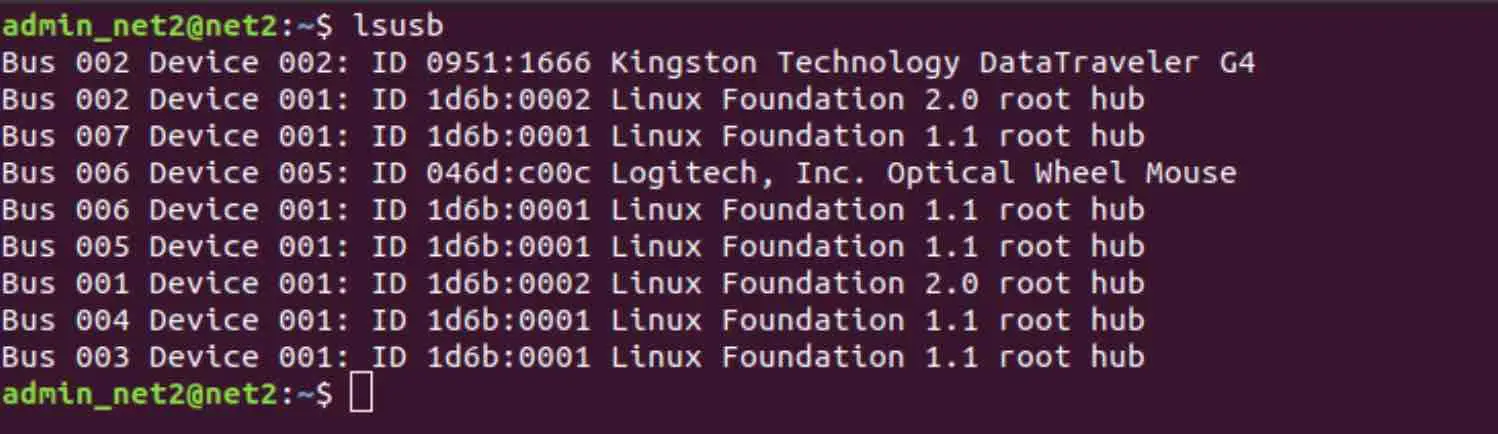
Using `lspci`: Exploring PCI Devices and Hardware List
The `lspci` command is your tool for inspecting devices connected to the PCI (Peripheral Component Interconnect) bus. This typically includes components like your graphics card, network adapters (Ethernet/Wi-Fi), sound cards, storage controllers, and more. By default, it gives a concise list.
You can increase the level of detail using verbosity flags: `-v` provides more information, and `-vv` gives even more. A very useful flag is `-k`, which tells you which kernel driver (module) is currently managing each specific PCI device. Another handy option is `-nn`, which displays the numeric vendor and device IDs `[xxxx:xxxx]`. These IDs are great for searching online if you need to identify specific hardware precisely.
Listing Basic PCI Devices
To get the standard list of PCI devices connected to your system, simply run:
lspci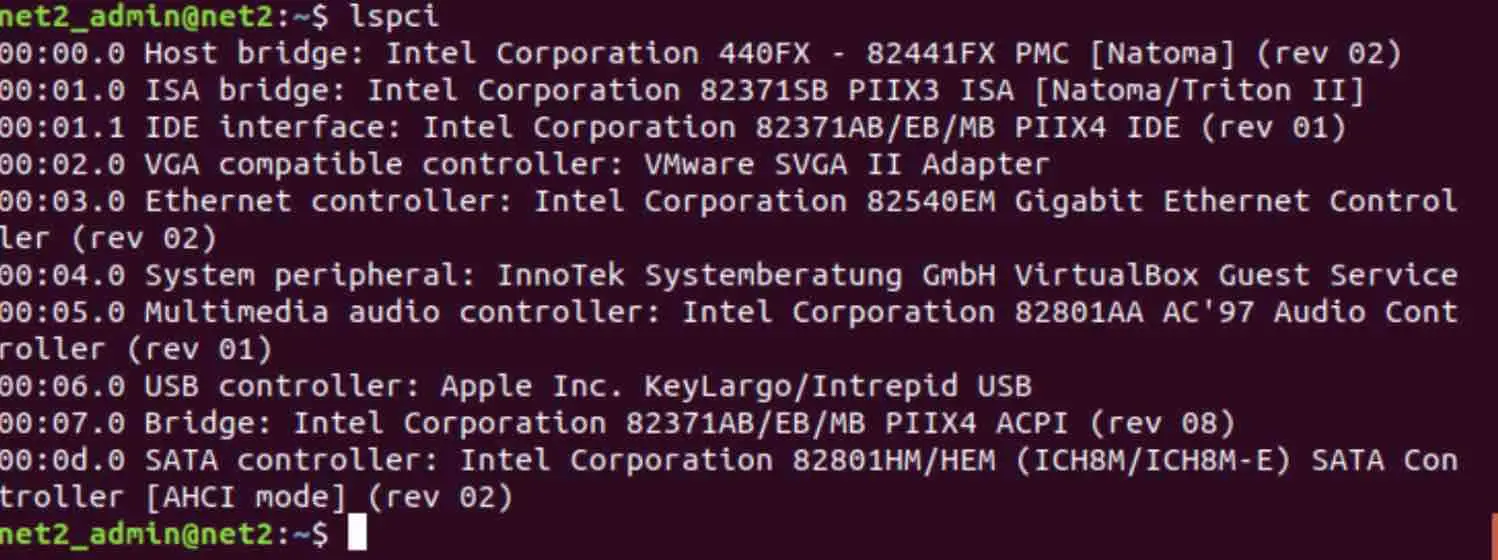
Finding Graphics Card Details Linux Command
Here’s a practical example using `lspci` combined with `grep` to specifically find your graphics card (usually listed as a “VGA compatible controller”) and see which kernel driver it’s using. The `-nnk` options show numeric IDs (`-nn`) and the kernel driver (`-k`). `grep VGA -A1` finds the line containing “VGA” and shows that line plus (`-A`) 1 line after it.
lspci -nnk | grep VGA -A1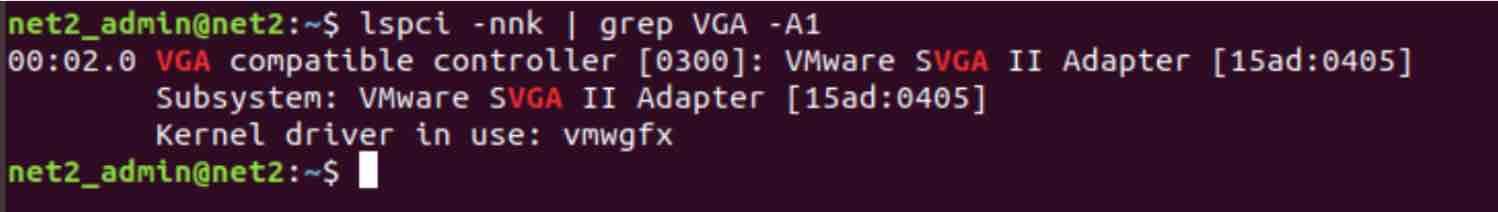
Read: How to display Graphics card information on Ubuntu 22.04
Viewing Audio Device Details
You can use a similar approach to find your audio device(s). This command uses the verbose flag (`-v`) and filters (`grep`) for lines containing “audio” (case-insensitive `-i`), showing (`-A7`) seven lines of context after each match to capture relevant details:
lspci -v | grep -A7 -i "audio"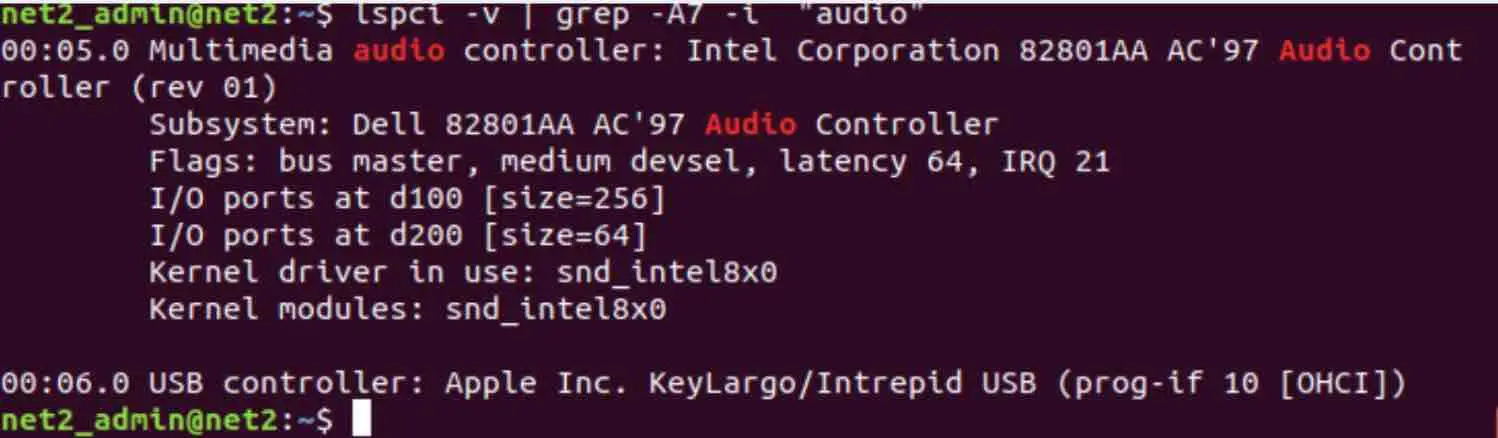
Checking Network Adapter Information
To get details about your network adapters (Ethernet or Wi-Fi), including the kernel driver they are using (`-k`), try this combination:
lspci -nnk | grep -i net -A2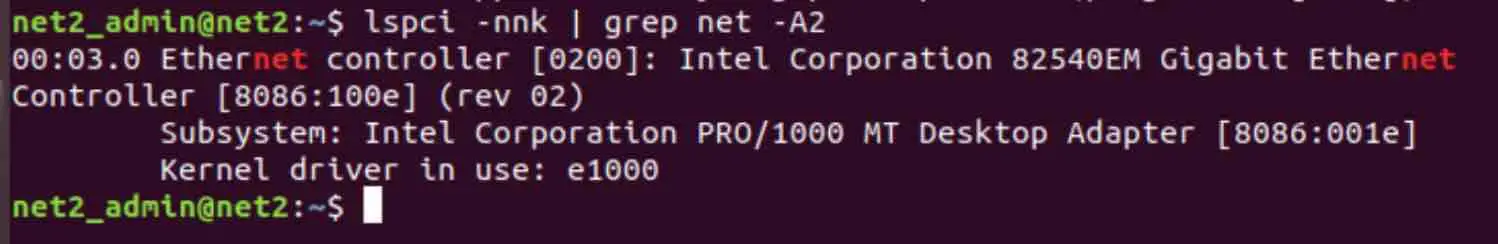
Using `hardinfo`: A Linux System Information GUI Tool for Ubuntu & Others
If you prefer clicking around in a graphical window instead of typing commands, `hardinfo` (often listed as “System Profiler and Benchmark”) is a fantastic choice. It might not be installed by default, but you can usually add it easily. On Debian or Ubuntu-based systems, the installation command is typically:
sudo apt update && sudo apt install hardinfo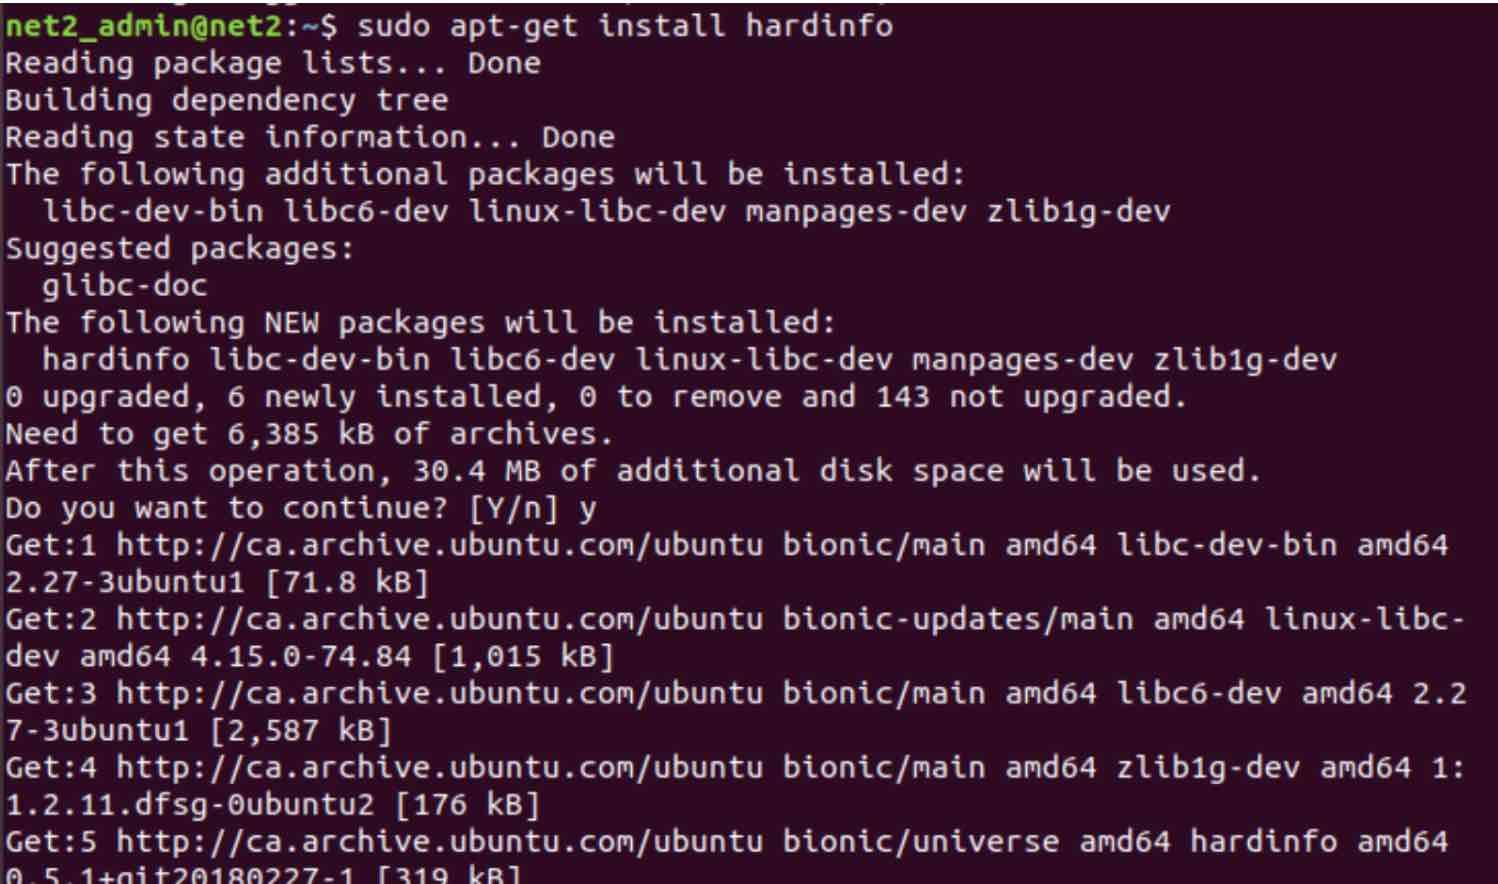
After it’s installed, you can launch it either by typing `hardinfo` in your terminal or by finding “System Profiler and Benchmark” in your application menu:
hardinfo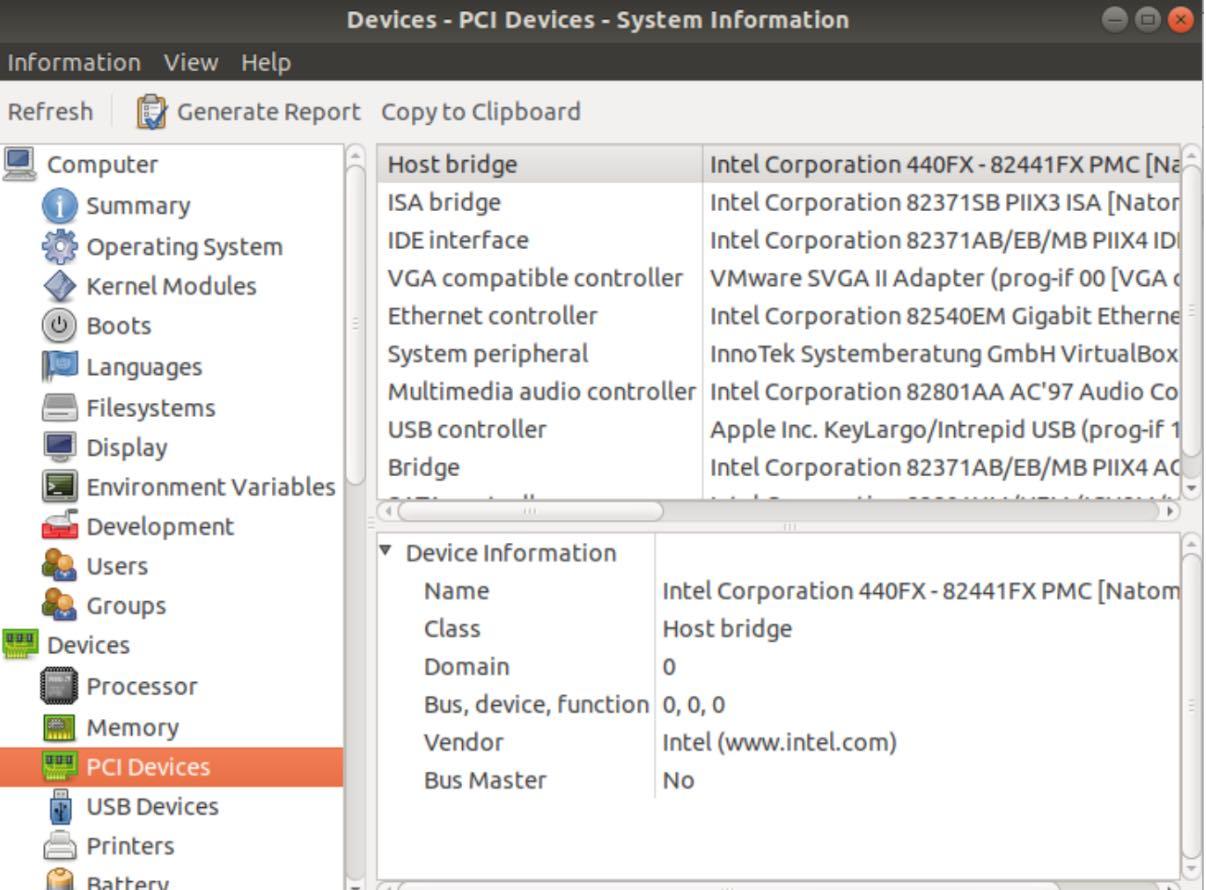
`hardinfo` offers a very user-friendly way to explore detailed system information. It often presents more data than the basic command-line tools, covering aspects like available Linux kernels, OS info, boot logs, connected USB hardware, and PCI devices. Plus, it includes some simple benchmark tests and the ability to generate a comprehensive report, which can be super useful for sharing or record-keeping.
Using `dmidecode`: Check BIOS Version and System Hardware Details
The `dmidecode` utility is a powerful tool that dives deep into your system’s hardware by reading data directly from its DMI (Desktop Management Interface) tables, sometimes referred to as SMBIOS (System Management BIOS) data. This data is typically populated by the hardware manufacturer.
Using `dmidecode`, you can uncover specific details about your system’s BIOS (vendor, version, release date), processor, RAM slots (DIMMs) and installed memory modules, motherboard information, chassis details, system serial numbers, and much more. Because it accesses low-level hardware data, you’ll usually need root privileges (`sudo`) to run it:
sudo dmidecode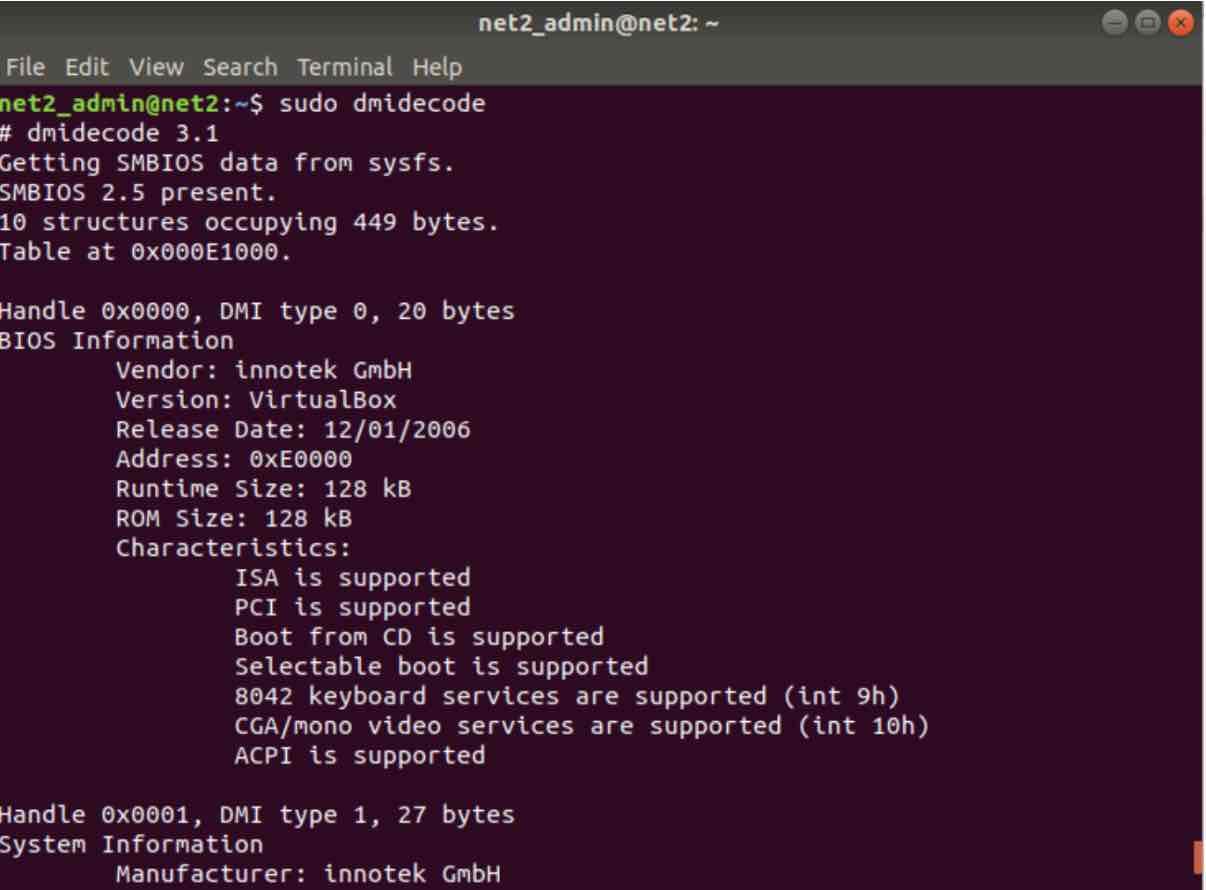
Using dmidecode as an Ubuntu hardware monitor
The output can be quite lengthy, organized into sections for different hardware components (BIOS, System, Base Board, Memory Device, etc.). It’s particularly valuable when you need precise information like memory module part numbers or the exact motherboard model.
Exploring `i-nex`: Another Graphical System Info Utility
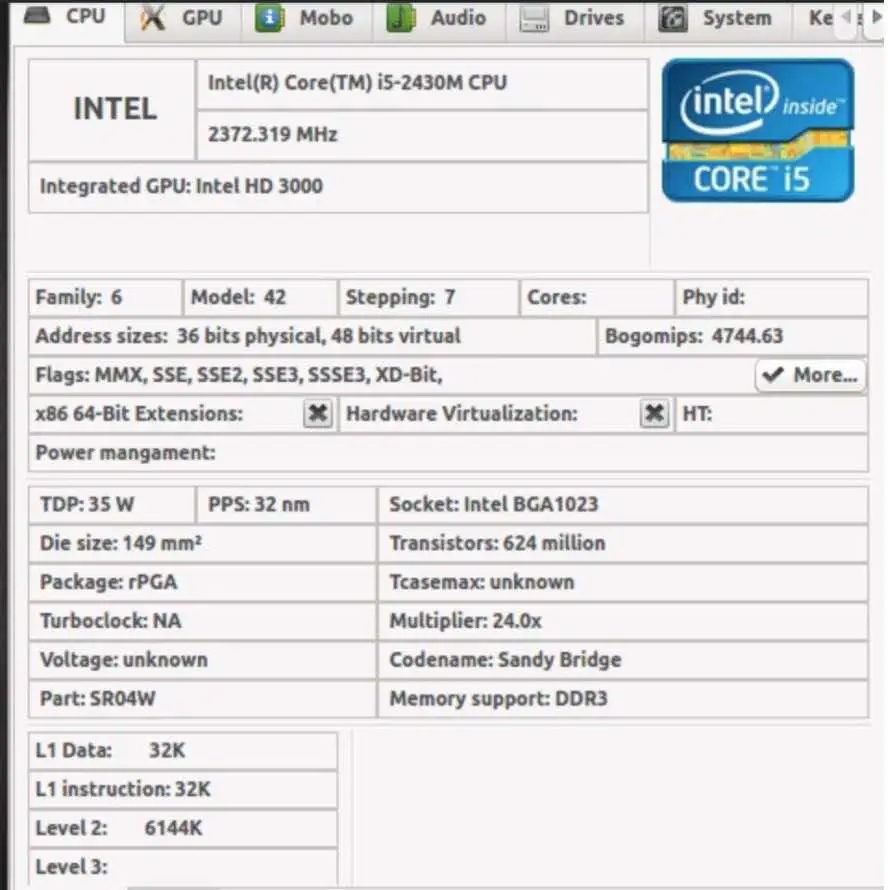
I-Nex provides another graphical approach to viewing system component information. Some users find its tabbed interface reminiscent of tools like CPU-Z on Windows. It displays details about the CPU, GPU (video), motherboard, memory, sound devices, USB peripherals, network interfaces, and more.
Installing I-Nex often requires adding third-party PPAs (Personal Package Archives), which should be done with caution as they aren’t officially maintained by your distribution. The typical installation steps on Ubuntu-like systems would be:
sudo add-apt-repository ppa:i-nex-development-team/daily
sudo add-apt-repository ppa:gambas-team/gambas3
sudo apt-get update
sudo apt-get install i-nex
Using `sysinfo`: Simple Graphical Linux Hardware Information Overview
`sysinfo` is one more graphical utility designed to gather and present a straightforward summary of both software and hardware information. It focuses on displaying key details about:
- System: Linux distribution name and release, kernel version, GCC compiler version, GNOME/Xorg versions (if applicable), and the system hostname.
- CPU: Processor vendor identification, model name, current frequency, Level 2 cache size, model numbers, capability flags, etc.
- Memory: Total installed RAM, currently free memory, total and free swap space, and stats on cached, active, and inactive memory.
- Storage: Information about detected IDE and SCSI storage devices and interfaces.
- Hardware: Quick summaries of the graphics card, motherboard model, sound card, and network devices.
- NVIDIA Graphics Card: Provides specific details if an NVIDIA display driver is installed and active.
Like `hardinfo`, it might need to be installed first. On Debian/Ubuntu systems, you can typically install it with:
sudo apt-get update && sudo apt-get install sysinfo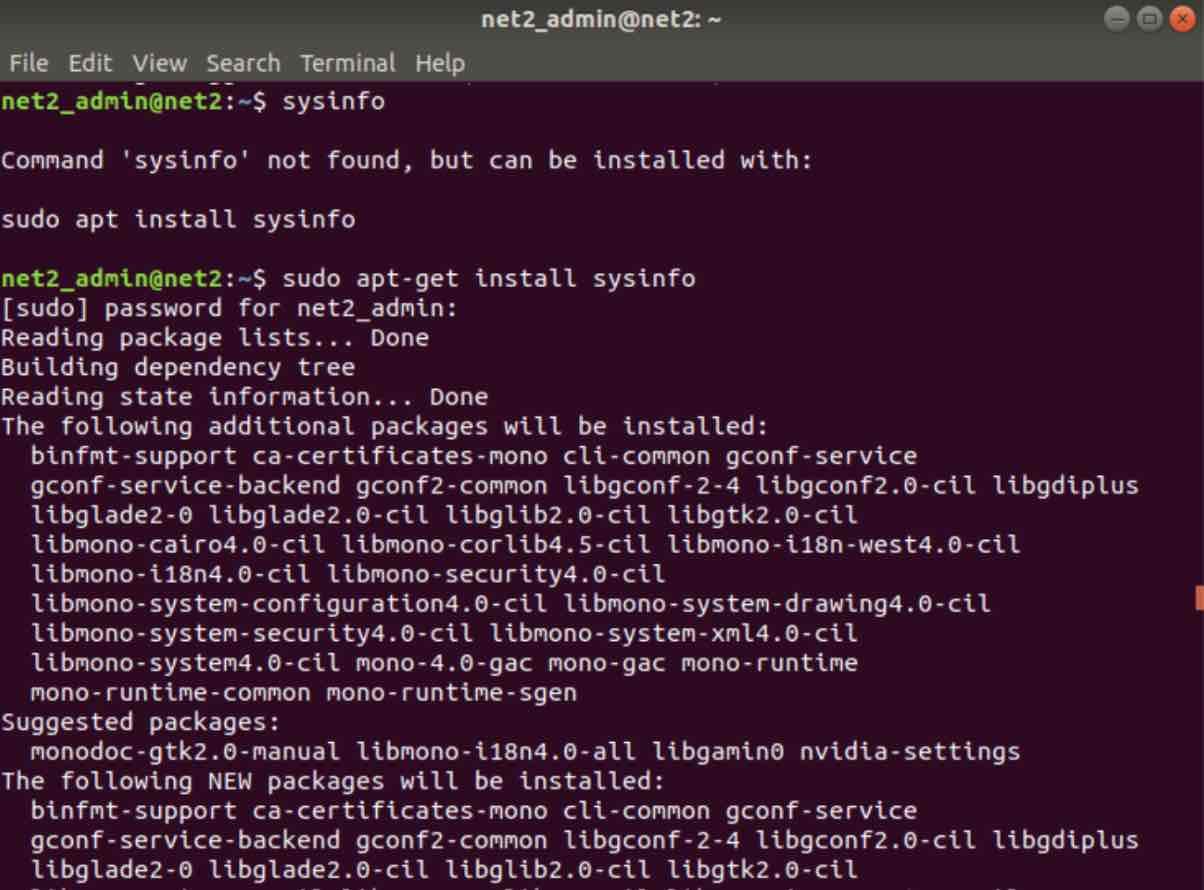
Getting Linux hardware info via sysinfo installation
Once installed, launch it from the terminal or your application menu:
sysinfo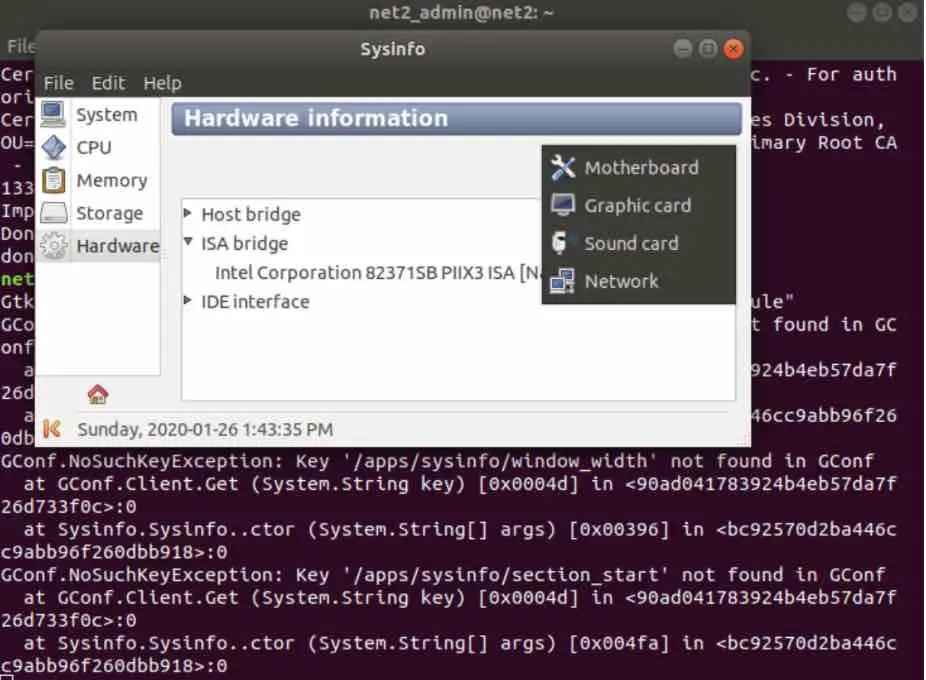
Wrapping It Up
And that’s a wrap! We’ve explored a variety of tools, from versatile command-line utilities like `uname`, `lshw`, `lscpu`, `lsblk`, `lsusb`, `lspci`, and `dmidecode`, to user-friendly graphical applications like `hardinfo`, `i-nex`, and `sysinfo`. Each one offers a unique way to gather either summarized or highly detailed information about your Linux system’s software configuration and hardware components.
Knowing how to use these tools is incredibly valuable for everyday Linux use – whether you’re troubleshooting an issue, checking if your system meets the requirements for new software, performing a Linux hardware compatibility check, or just satisfying your curiosity about what’s under the hood. This knowledge is also fundamental for system monitoring. For more on Linux monitoring tools, you might find our article here helpful.
Do you have a favorite tool for checking system specs that we didn’t cover, or a neat trick for using one of these? Please share your thoughts and experiences in the comments section below – I always enjoy learning new tips!
Frequently Asked Questions (FAQ)
Q1: How to check Linux distribution version command line?
While the tools above focus mainly on hardware and the kernel, finding your specific Linux distribution and version is also common. The most reliable way usually involves checking the content of specific files in the `/etc/` directory. Try this command first:
cat /etc/os-releaseThis file usually contains details like `NAME`, `VERSION`, `ID`, `VERSION_ID`, and `PRETTY_NAME`. Alternatively, if your system supports LSB (Linux Standard Base) commands, you can use:
lsb_release -aQ2: What is the easiest way find Linux architecture terminal (32-bit or 64-bit)?
The simplest and most common command for this is `uname -m`. As discussed earlier, an output like `x86_64` indicates a 64-bit architecture. An output like `i386` or `i686` typically indicates 32-bit. Another very direct command is `arch`, which usually gives similar output.
uname -marchQ3: How do I get quick hardware summary Linux command line?
For a fast, readable summary of your main hardware components directly in the terminal, `sudo lshw -short` is an excellent choice. It provides a categorized list (processor, memory, display, network, storage, etc.) without the extensive detail of the full `lshw` command.
sudo lshw -shortQ4: How can I find detailed motherboard info Linux including RAM slots?
For the most in-depth details about your motherboard (Base Board), BIOS, and specifically the physical memory slots (DIMMs) and the RAM modules installed in them, `sudo dmidecode` is generally the best tool. Look for sections like “Base Board Information” and “Memory Device” in its output.
sudo dmidecode | less(Using `| less` helps navigate the long output).
Q5: How to identify kernel driver network card Linux command line?
The `lspci` command combined with the `-k` flag is ideal for this task. To specifically find your network card and its driver, you can filter the output using `grep`. Try this:
lspci -k | grep -A 3 -i 'ethernet\|network\|wireless'This command looks for lines containing “ethernet”, “network”, or “wireless” (case-insensitive) and shows (`-A 3`) those lines plus the three lines following each match. You should see a line that says “Kernel driver in use:” which indicates the module managing that network device.
If you like the content, we would appreciate your support by buying us a coffee. Thank you so much for your visit and support.