Does your Linux laptop battery drain faster than you’d like? Look no further than PowerTOP! This powerful tool can help you diagnose power consumption and optimize your system for extended battery life.
What is PowerTOP?
Developed by Intel, PowerTOP is a diagnostic application specifically designed for Linux laptops. When you’re unplugged, it closely monitors power usage by various programs running on your system. This valuable information empowers you to identify power-hungry applications and optimize settings for better battery life.
PowerTOP’s Interactive Advantage
PowerTOP is more than just a monitoring tool. It boasts an interactive mode that allows you to fine-tune various power management settings directly within the application. This gives you granular control over how your system utilizes power, enabling you to strike the perfect balance between performance and battery life.
Read: How to display Graphics card information on Ubuntu 22.04
Installing PowerTOP on Ubuntu and Similar Distributions
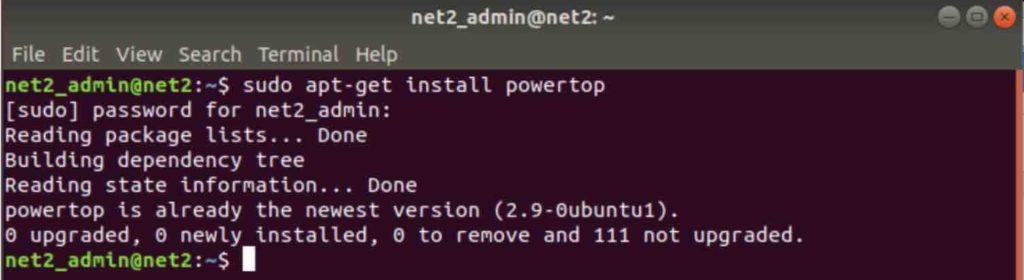
Ready to unlock the power-saving potential of PowerTOP? On Ubuntu and similar distributions, installing PowerTOP is a breeze. Simply open your terminal window (usually a black box application) and type the following command, followed by your password when prompted:
sudo apt-get install powertop
Unleashing PowerTOP’s Potential: A Guide to Usage
Now that you’ve installed PowerTOP, let’s dive into how to use it and unlock its battery-saving magic!
Why Root Privileges?
Since PowerTOP interacts directly with your system hardware to gather power consumption data, it requires root privileges to function effectively. This ensures it has the necessary access to analyze your system’s power usage patterns.
Running PowerTOP
To start PowerTOP, open your terminal window (usually a black box application) and type the following command, followed by your password when prompted:
sudo powertop
Before diving into PowerTOP’s interface, it’s essential to unplug your laptop. This allows the tool to accurately monitor battery power consumption.
Understanding the Power Landscape
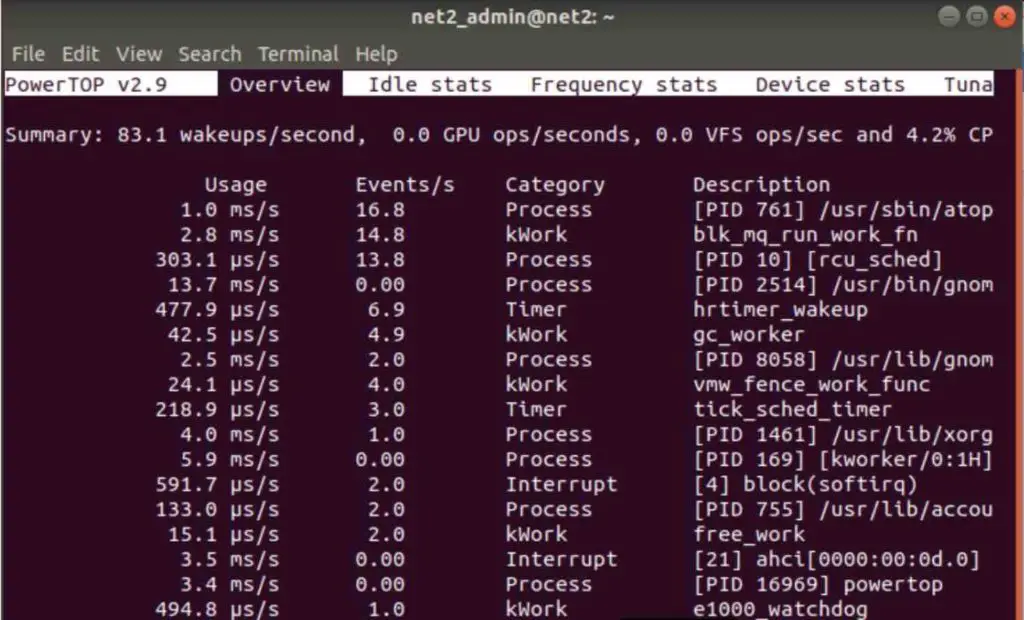
Once you launch PowerTOP, you’ll be presented with a wealth of information regarding your system’s power usage. This snapshot provides a clear picture of:
- Overall Power Consumption: Get a quick grasp of how much power your system is using in total.
- Power-Hungry Components: Identify the hardware components that are draining your battery the most. These could be devices like your Wi-Fi card, hard drive, or even the processor itself.
- Wake-Up Woes: See which processes or activities are most frequently triggering “wake-up calls” to your processor. These wake-ups can significantly impact battery life.
PowerTOP categorizes these insights into tabs at the top of the screen:
- Processes: This tab reveals applications or background tasks contributing to power consumption.
- Devices: Here, you’ll see the power draw of individual hardware components on your system.
- Kernel Workers (kWork): These are internal system activities that can sometimes contribute to power drain.
- System Timer: This tab displays the power impact of system timer events.
- Interrupts: Interrupts are signals sent to the processor, and frequent interrupts can affect battery life.
Navigating the Interface
The bottom of the screen provides a helpful tip: use Shift + Tab keys to switch between these tabs for a more comprehensive analysis of your system’s power consumption.
Read: Monitoring system processes in Ubuntu using htop
Idle stats tab
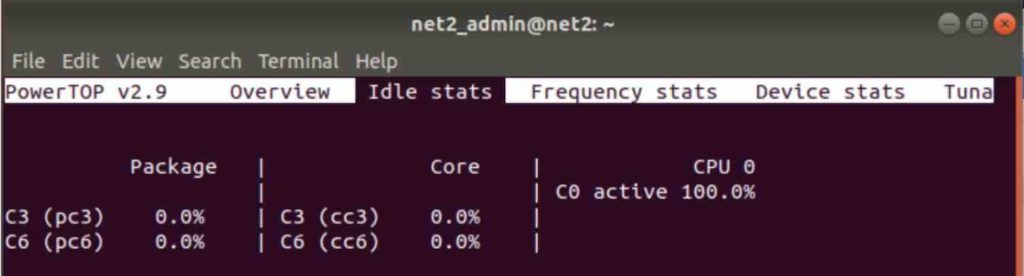
This displays details about the processor C-states, which are utilized to minimize or optimize power usage when the system is idle.
Frequency stats tab
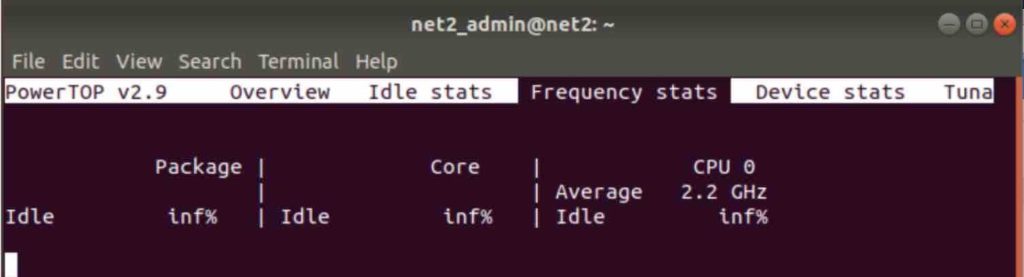
This tab displays the rate of CPU wake-up calls.
Device stats tab
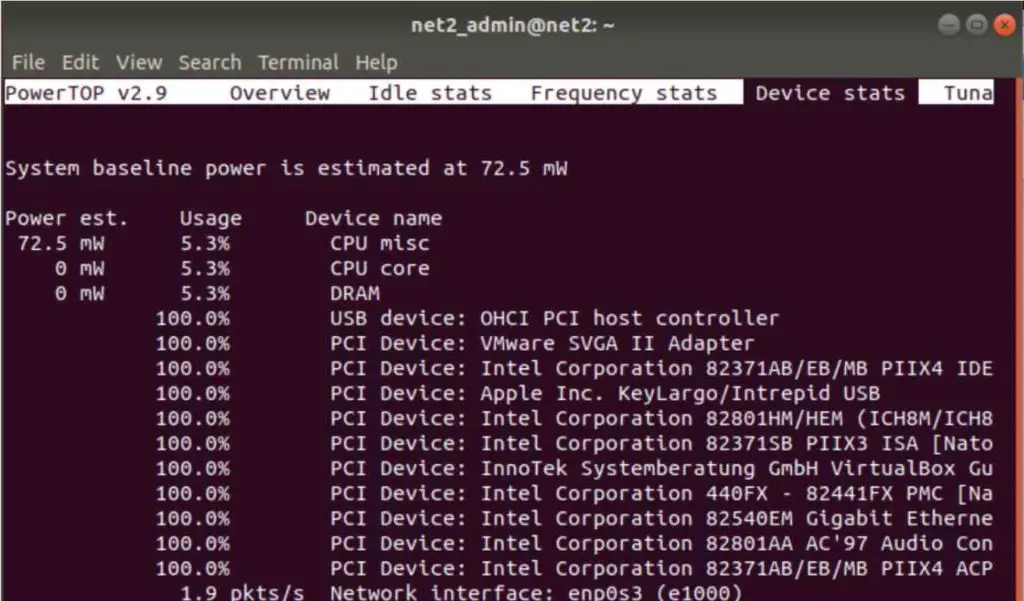
This tab presents data similar to the main tab but specifically pertains to devices.
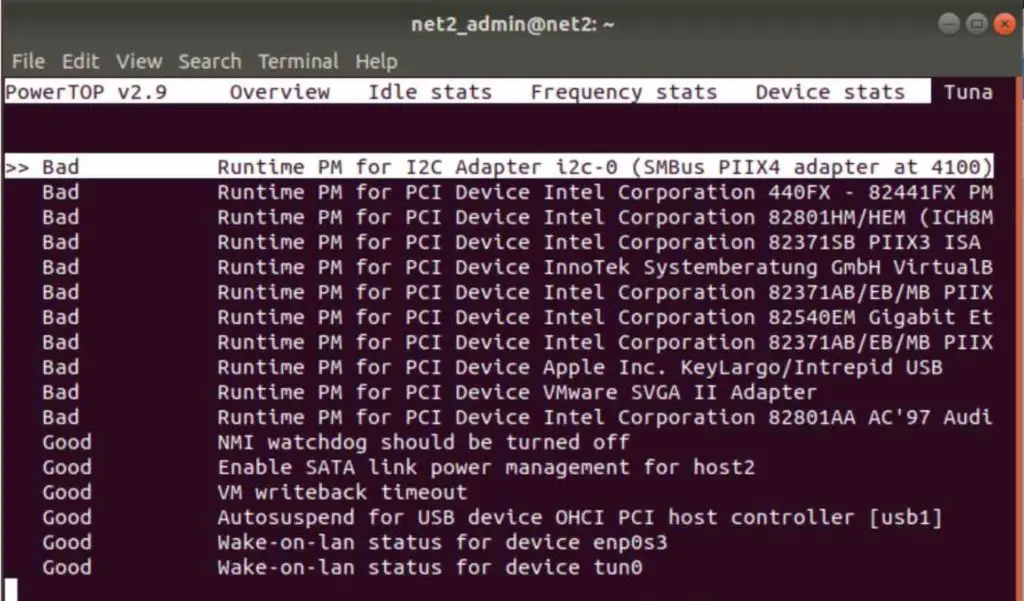
Tunables tab
The “Tunables” tab within PowerTOP is your treasure trove for optimizing battery life. Here, you’ll find valuable suggestions to minimize system wake-ups, which are a major culprit in battery drain.
Understanding the Tuning Recommendations:
PowerTOP analyzes your system and identifies settings that could potentially improve battery life. These recommendations fall into two categories:
- “Bad” This indicates that a setting is not currently configured for optimal power savings. While it might not be ideal for battery life, it might be beneficial for system performance.
- “Good” This signifies that a particular setting is already configured in a way that conserves battery power.
Taking Control with the Enter Key:
The beauty of PowerTOP lies in its interactivity. You can experiment with these settings directly within the interface! Simply press the Enter key on a specific recommendation to toggle it between “Good” (power-saving) and “Bad” (better performance).
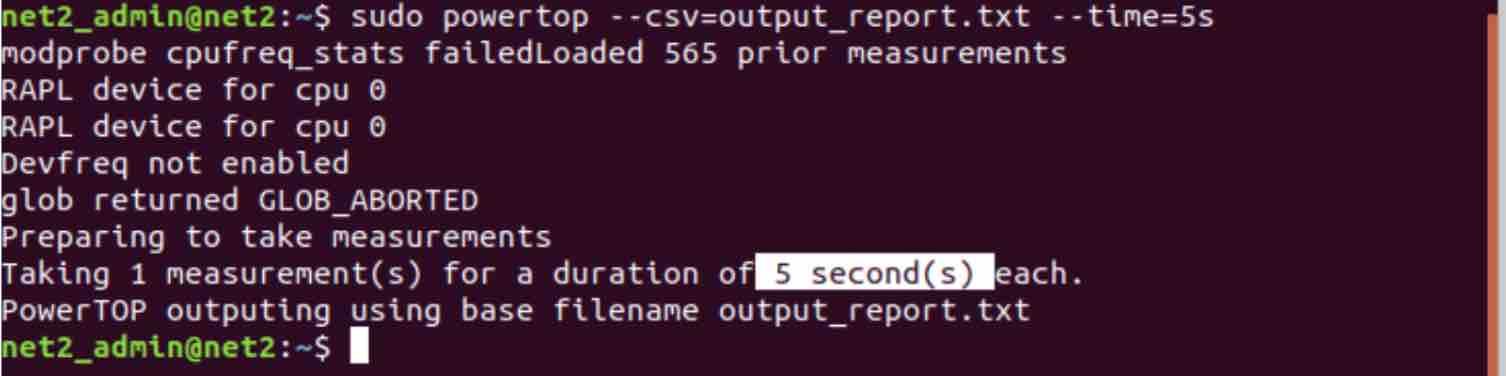
Report Generation –in CSV format
PowerTop enables you to create a CSV report for a specified duration. In the command below, we will generate a report for 5 seconds.
sudo powertop –csv=output_report.txt –time=5s
To view the generated report, use the following command in your preferred text editor:
![]()
You will be able to see the following entries :
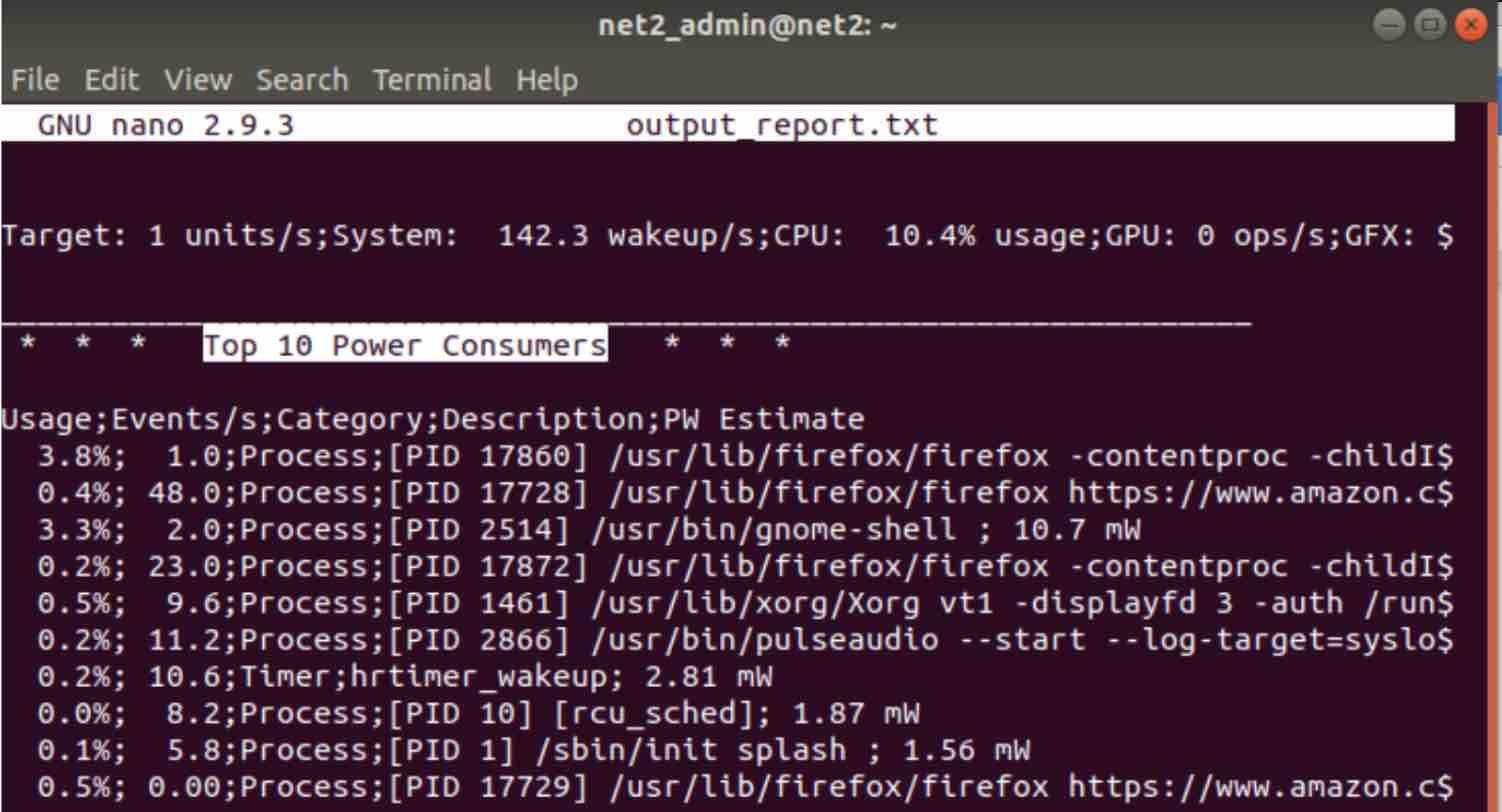
This shows the highest 10 power users.
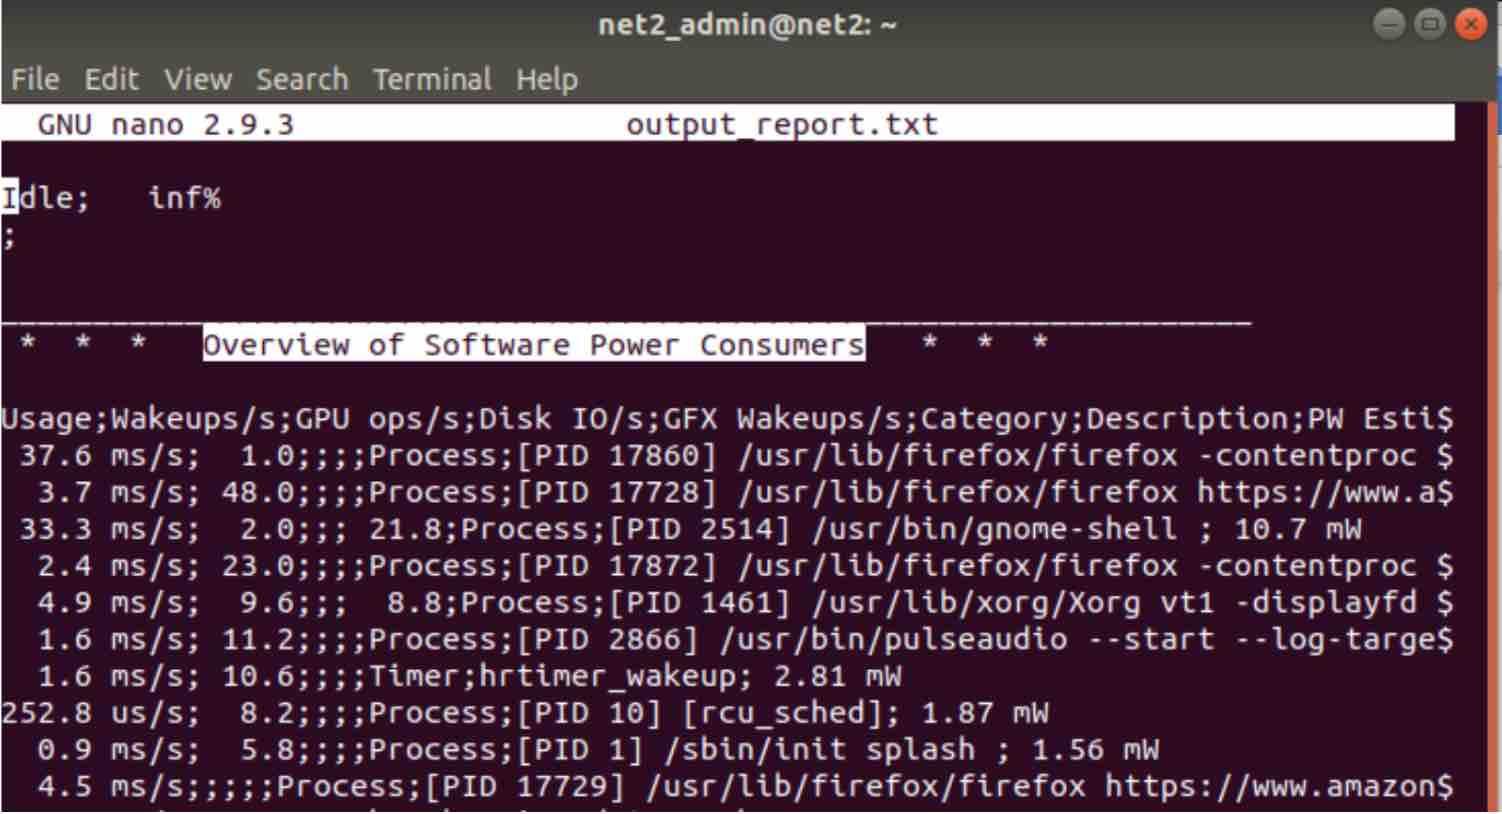
Here, we can see a summary of software power consumers, indicating the processes that utilize the highest amount of power.
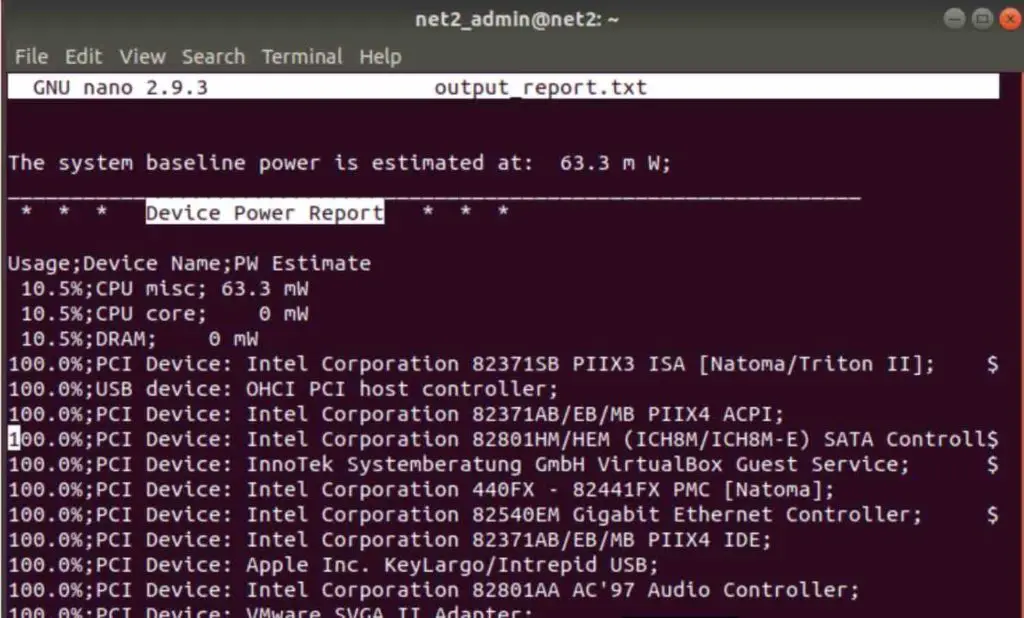
Device power report is displayed above.
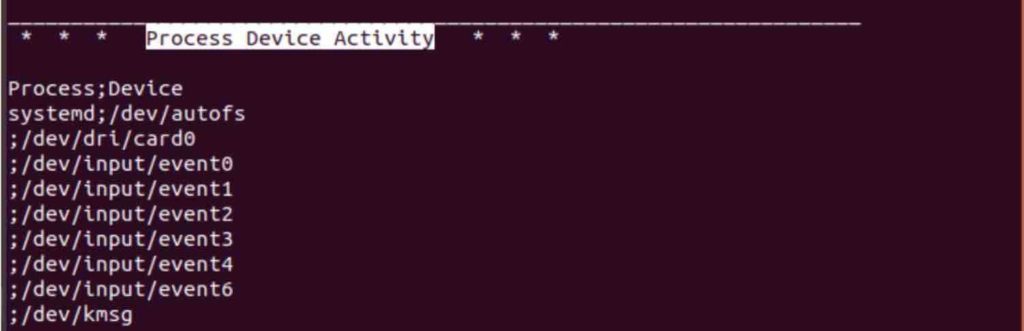
Process device activity is shown.
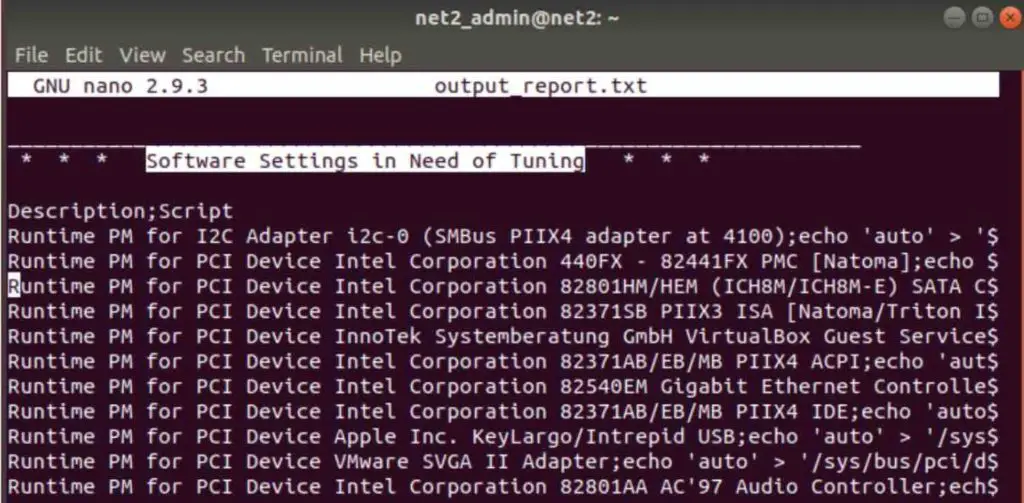
The snapshot above shows the software settings that need tuning.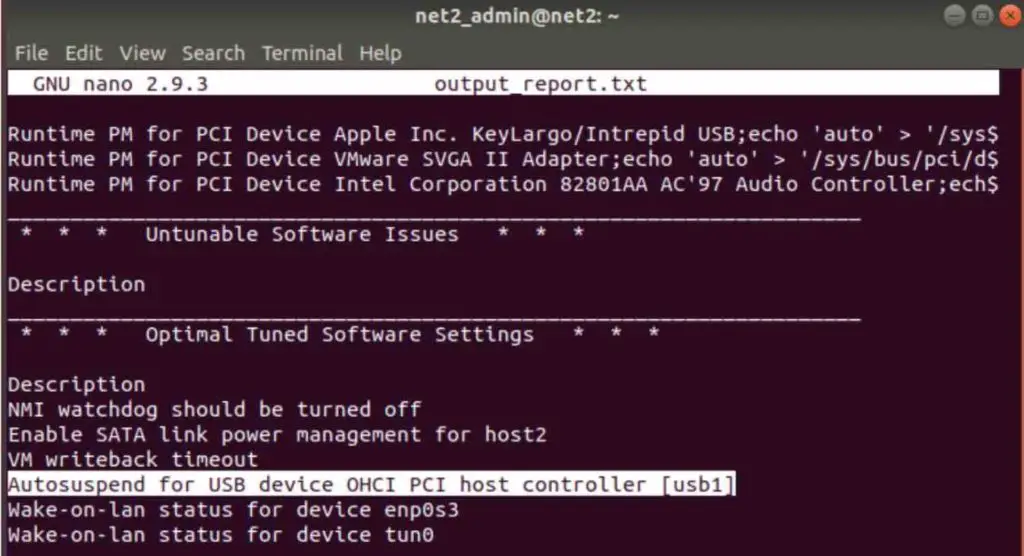
Below are some recommendations for fine-tuning to achieve optimal performance.
Read: Linux Ubuntu/Debian monitoring tools guide for system administrators
Report Generation in html format
While the default view provides real-time insights, sometimes you might need a more comprehensive report. PowerTOP allows you to generate an HTML report, perfect for capturing a snapshot of your system’s power usage at a specific time.
Generating the HTML Report:
Open your terminal window (usually a black box application) and type the following command, replacing output_in_html with your desired filename for the report (e.g., battery_report.html):
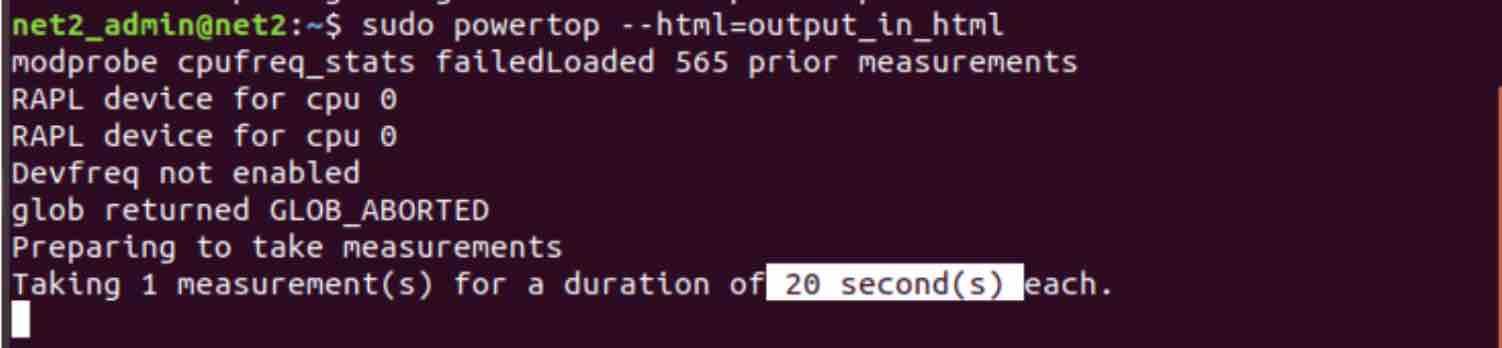
powertop –html=output_in_html
By default, this command generates a report that captures data for 20 seconds. If you need a longer timeframe, you can specify the duration using the –time option. Here’s an example for a 60-second report:
powertop –html=battery_report.html –time=60
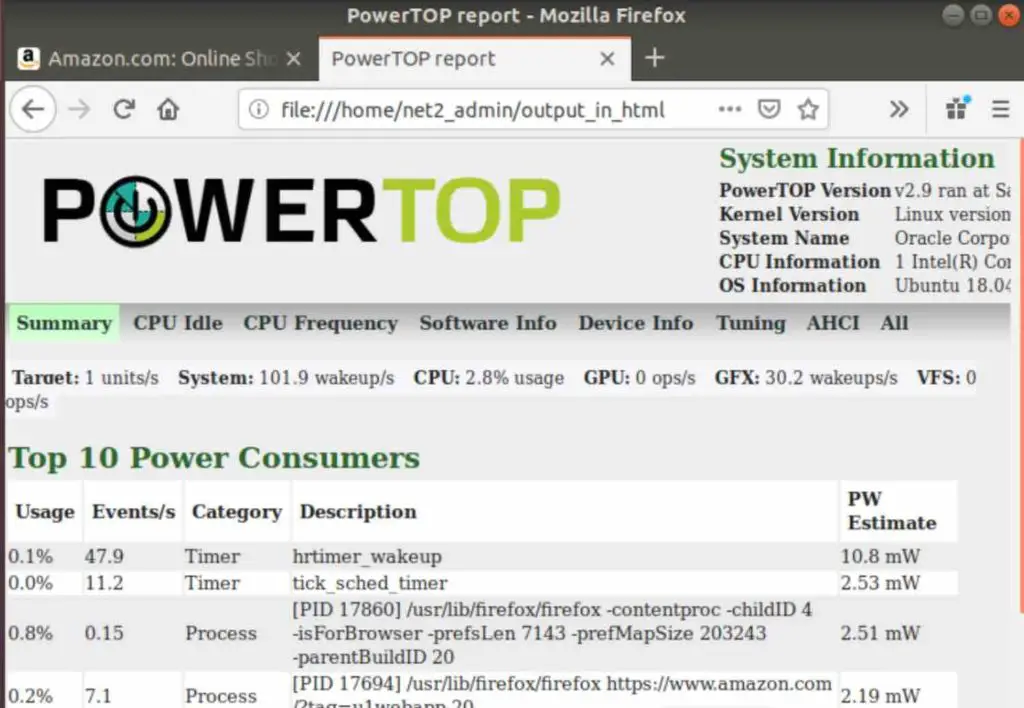
The generated report can be shown in a browser :
Conclusion
We’ve reached the end of our journey into the world of PowerTOP! By now, you’re equipped to:
Install and utilize PowerTOP to monitor your Linux laptop’s battery consumption.
Understand the valuable insights it provides on power-hungry components and wake-up triggers.
Leverage the “Tunables” section to experiment with power-saving settings and find the optimal balance for your needs.
Generate HTML reports for detailed analysis or sharing your battery usage data.
Now it’s your turn to put PowerTOP to the test! Install it on your Linux laptop and observe the impact on your battery life. By implementing the suggestions and finding the right settings, you can extend those unplugged sessions and enjoy more productivity on the go.
If you like the content, we would appreciate your support by buying us a coffee. Thank you so much for your visit and support.