With a bicentennial timeline, the Gantt chart “witnessed” the emergence of countless solutions in project, activity and process management and, even so, it remained firm and strong – which proves its effectiveness in these most diverse managementrelated purposes.
Read on to learn more about this tool.
What is a Gantt Chart?
The Gantt chart is a visual representation to support teams and managers as they carry out projects . It works as a sort of timeline, letting the people involved know how close or far they are to completing a given task.
Although it is suitable for all types of activities, it is in more complex projects that the scheme is even more useful. This is because, through the Gantt chart, the team gains the ability to coordinate interdependent activities and tasks.
To set up or outline strategic planning , for example, few tools are as valuable as this one. As long as the people and leaders involved know their respective deadlines and activities to be fulfilled, with the Gantt chart it is possible to meet schedules and avoid delays.
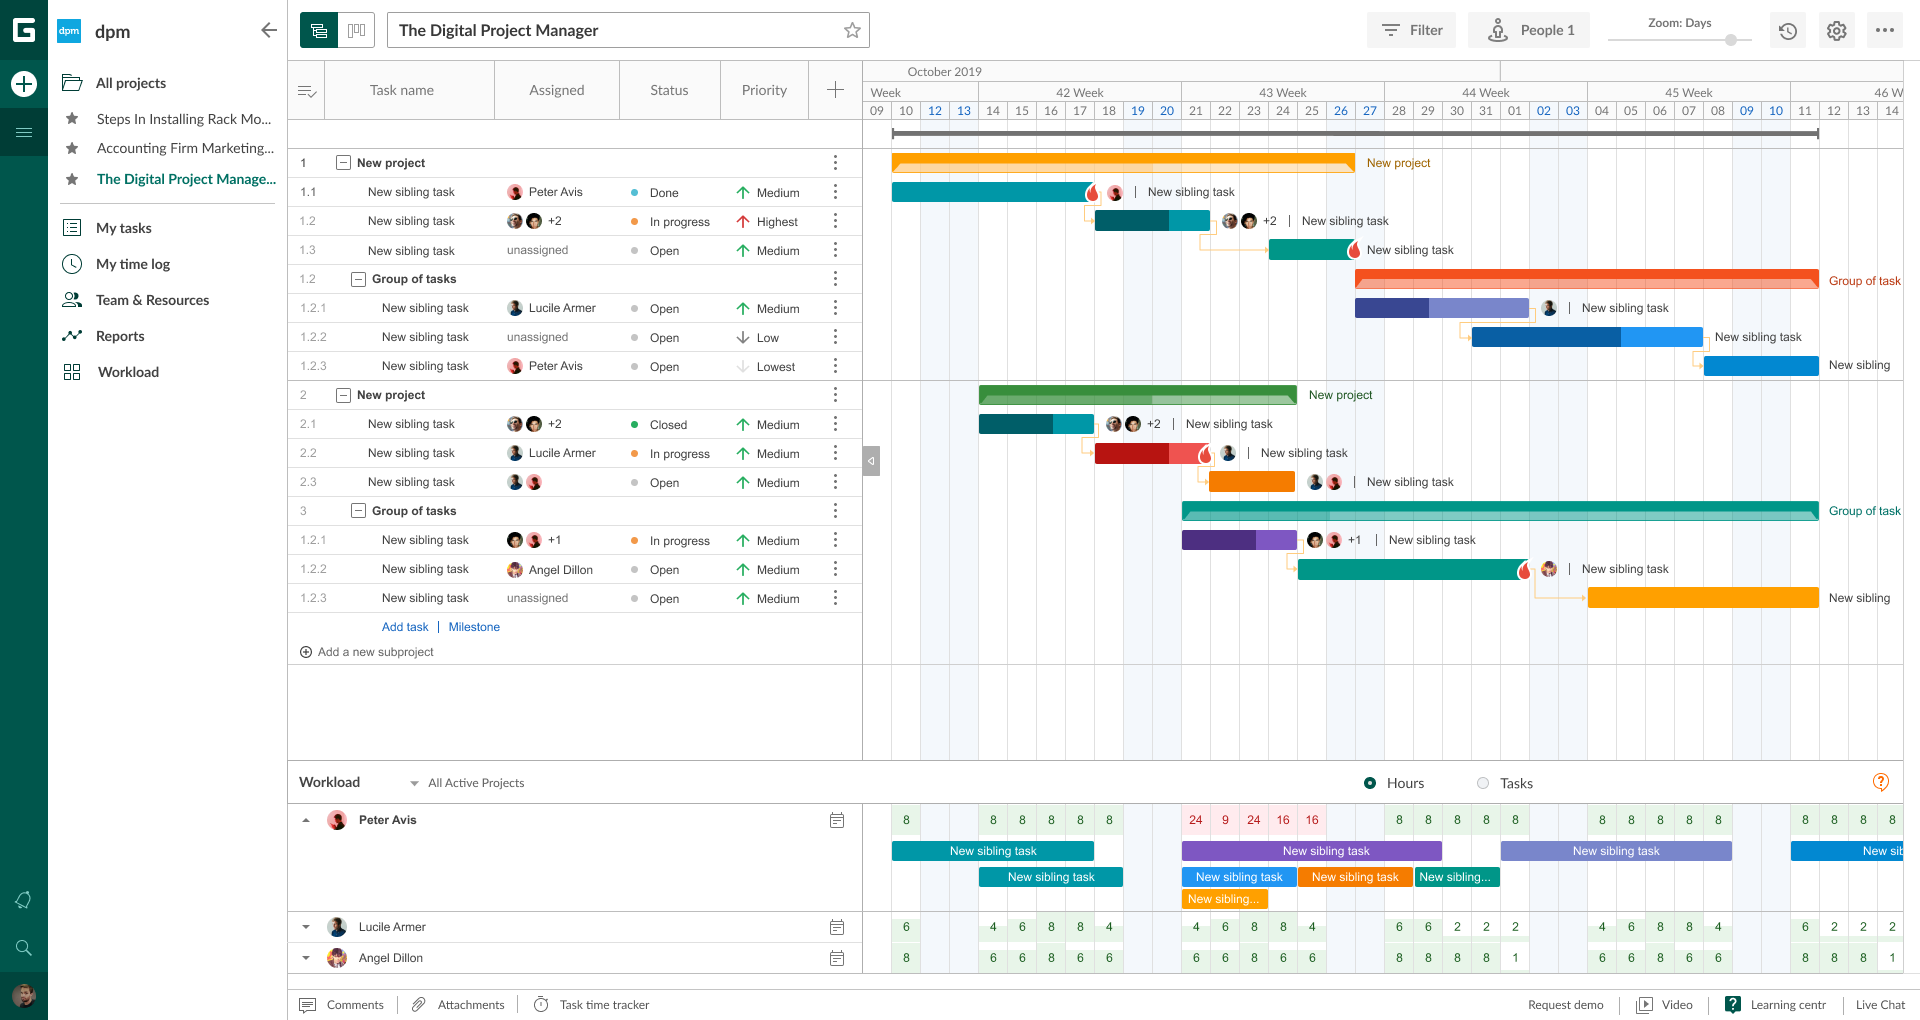
Source: Ganttpro
How did the Gantt chart come about?
The project management has accompanied humanity since the Ancient Age. From the most rudimentary mill to the most advanced industrial plant, there is no way to coordinate an action plan without control tools. It was probably thinking like this that, in 1910, the American engineer Henry Gantt decided to improve the old model. Created by Polish Karol Adamiecki in 1800, this is the first known Gantt chart.
By the way, Gantt’s professional trajectory is intertwined with that of the beginning of the US industry itself. That’s because he worked at the famous Midvale Steel industrial complex, with none other than Frederick Taylor, regarded as the father of modern management.
In this way, the historical roots of the inventor of the Gantt chart already point to its timelessness. It’s more or less like the light bulb, the telephone and the radio. Technologies superior to these inventions may even emerge, but they will always have their place thanks to the enormous reach they had.
What are the advantages of a gantt chart?
In the midst of Digital Transformation, there is no shortage of advanced management tools that can be designed on demand. In other words: it is possible, today, to go to the market and find the right utilities for a business. So why resort to the Gantt chart?
Perhaps this universality and acceptance can be explained by the ease of assembling it for immediate application in any type of project . Even with an Excel spreadsheet it is possible to architect a Gantt chart for instant use. Therefore, it is not an exaggeration to consider that this is a tool that is both effective and accessible.
However, being accessible by itself doesn’t make it worthwhile, right? After all, if it didn’t represent a gain, this diagram wouldn’t last through the centuries. Therefore, what can be safely said about it is that those who apply it perceive advantages in the following tasks and activities.
Read: Best free project management software
Define delivery times
There is no way to cite the Gantt chart without immediately associating it with meeting deadlines. This is perhaps the main function it serves, that is, to be a guarantor that teams and people will deliver the delegated tasks within the stipulated schedule.
Therefore, it becomes extremely useful not only for the control of activities but also for a more efficient financial management . After all, nothing is more expensive for a company than tasks that are not executed on time or deliveries that are not made. The Gantt chart is always useful for setting deadlines because it links activities that depend on others to get started.
An example of this is the development of a website. In its architecture, the work of the IT team depends on the SEO team, which in turn works with the Design staff. Whatever the project, all deliveries in interdependent industries can have precisely defined deadlines when using the Gantt chart.
Allocate responsibilities
In modern startups and companies with a technological bias, collaborative management has been the most used format to manage processes and relationships. It is based on the horizontal hierarchy model, in which although the boss figure continues to exist, more individual autonomy is granted. In this context, how to delegate functions, assign responsibilities and, at the same time, keep a team under control?
The Gantt chart, in this respect, is extremely effective as a self-management tool . As it is possible to assign tasks to specific people, it allows a project to be viewed as a whole by everyone at the same time. This makes it much more difficult for a member to procrastinate, as he will know that everyone will monitor the progress — or not — of their activities.
Segment tasks
Another challenge that the Gantt chart helps to overcome and that makes its application advantageous is its ability to segment tasks. This is especially true for companies or institutions in which tens or hundreds of people are simultaneously involved in one or more projects.
With this tool, it is possible to break large tasks into smaller ones indefinitely, making their control much simpler . As an effect of this, the trend is for productivity to remain at constant levels.
Imagine, for example, the manufacturing process of a more complex product, such as a car. Certainly, what is not lacking from the beginning to the end of its production are minor tasks linked together and which, if not carried out, impede the continuity of the assembly process.
This is more or less how the Gantt diagram proves to be advantageous. For many years, it has remained the best resource for “unraveling” activities that are too complex and, therefore, require fractionation and specialization.
Read: Guide to Social Media for Small Businesses
Have more flexibility
Do you know the agile methodology ? In general terms, it preaches efficiency above bureaucracy and formalism to benefit the client . On the other hand, following rules is necessary to avoid chaos and to facilitate decision making. In this aspect, tools such as the Gantt chart are of great value to ensure the necessary agility in highly complex projects . At the same time, it helps to control compliance with deadlines and quality standards.
It’s perfect for maintaining a constant balance between control and informality. In many software used to make this diagram, it is even possible to configure alerts for the proximity of deadlines and deadlines. In this way, everyone becomes responsible for their part in a project, without this implying loss of control or excessive freedom.
Track progress
In addition to allowing you to trace a timeline for projects and the breakdown of more complex tasks, the graph also works as a kind of monitor. Therefore, indirectly it ends up also serving as a tool for performance assessment. When viewing members or teams who are late or up to date with their tasks, the manager who uses it can directly assess people’s performance.
As we’ll see in the next topic, by evaluating performance by constant monitoring, it’s even possible to take steps to motivate and engage. Since everyone involved must have access to the chart — at least that’s how it should be — it is possible to promote healthy competitiveness and thus increase commitment.
Be more motivated
Speaking of performance , your best presentation depends directly on the motivational factor. In contrast, motivation is also a subjective element. What makes an employee more engaged is not necessarily the same as what works for a third party.
By implementing the Gantt chart, motivation, at least with regard to internal competitiveness, can be generated more spontaneously. Deadlines, roles and assignments will always be there, visible, and anyone who fails to do their part tends to be frowned upon by other team members.
It should be noted that this is not about being motivated by embarrassment. In fact, the Gantt chart is used for transparency increase and thus to tighten the bonds that bind a team together . In this sense, it must be agreed that teams that work more cohesively are always more productive and tend to collaborate more with each other. In a cooperative regime, people naturally feel more comfortable and therefore more motivated to work.
How to use a gantt chart?
Another amazing feature of the Gantt chart is that, with the advancement of technology , it just got better and better. Thus, over time, functions, resources and even more interesting possibilities were added for those who need to control teams.
In process management , this diagram is probably the most useful of the tools because it simply shows the beginning and end of an activity. Even a child can read and interpret a sequence of lines and know where each one starts and where it ends.
Therefore, to use it, you must always focus on the issue of time management. That is, after all, the great purpose and justification for implementing the Gantt chart. It doesn’t hurt to remember that time is and always will be the only resource that, once lost, never recovers. So, it must always be used intelligently and controlled by the proper tools.
To do this, consider that the diagram operation is very simple. It consists of an overlaid line graph representing tasks, each entered at a period marked at the end of the table . It is enough, then, to analyze each line with the period in which they are framed to know if an activity is or not within the stipulated period.
Read: How to start your own digital business
How to assemble the chart?
It is not by chance that the Gantt chart is used to assemble everything from a strategic action plan to the simplest of projects in a microenterprise. Every manager can benefit from its use, even if they do not have software equipped with this solution.
Anyway, it is necessary to warn you that management software that rely on the Gantt chart in their functions are always more complete. So, depending on your business needs, it’s possible that a hand-drawn chart isn’t enough to help you achieve your goals.
That said, let’s look at how to make a gantt chart in excel.
Create a task table
The first step is to open the blank spreadsheet and enter the activities and tasks to be performed in a column. In a column to the side, enter the start date and, in a third, the end date. Be sure to take a close look at which tasks have overlapping deadlines and which ones depend on the completion of another to get started. Then adjust the schedule and only move forward when you are completely sure about the deadlines for each.
Build a bar chart
Now, you should search in the Excel version you are using by the option “Insert chart”. The Gantt diagram is always the one with overlapping horizontal bars. Choose it and go to the third step.
Format the Gantt Chart
This will be the most complex phase, but nothing you have to worry about. First, check the “No Filling” option in the dialog box. Then, click on the graph, which by now will be visible and look for the option “Format axis”. In the minimum and maximum limits, you can enter 1 and 31, in reference to the days of the month.
Then, in the “Main” field, mark the number 1. Now, just finish off by erasing the legend in which the colors appear. If you prefer, name your graphic with the project name.
Now that you know what a Gantt chart is, you will certainly have a powerful tool in your hands to better manage all your activities. However, remember: although it can be put together in a spreadsheet, when you have added software its effectiveness is even greater.
If you like the content, we would appreciate your support by buying us a coffee. Thank you so much for your visit and support.