Running a business requires many challenges; one of them is to define the best indicators so that the team can understand what results are being generated for the company. Another challenge, of equal importance, is to clearly disclose how much the goalsare being achieved so that everyone can quickly understand what is good and what needs to be improved . One way that has been widely used is Visual Management, which, in addition to being very effective in communicating performance, can also increase productivity in companies.
What is cash management
Visual management is nothing more than a form of visual communication, which can be understood by anyone who is viewing the information.
It communicates with a language accessible to everyone who sees it, bringing improvements through information sharing. Such as:
- Provide accessible and easy information, facilitating daily work and increasing the desire to work with greater quality;
- Make the information available to as many people as possible;
- Reinforce autonomy, enrich relationships and encourage participation;
- Make information sharing part of the company’s culture.
It is a visual way to engage and communicate to all involved processes so that decision making is more agile which increase the sense of responsibility and independence.
Depending on the technology used, this information can be made available in real time. What to provide depends a lot on each manager. Some have a little more difficulty showing what the company is doing and think that publicizing poor performance can undermine the team morale. However, the more transparent the visible management is, the greater the engagement of employees can be.
Read: Best free project management software
The purpose of this model is to make it possible for the main indicators and metrics necessary to monitor the company’s performance to be within the reach and understanding of everyone, in a quick and easy-to-interpret manner.
The formats can be the most diverse: we can have a chart showing a relevant metric, or a set of them in a single panel where several metrics and indicators related to each other are available at the same moment (dashboard). A good example of a dashboard is a car’s dashboard , where we have at the same time speed information (important to avoid getting a ticket) and engine safety data such as rotation (revolutions per minute) and temperature. On the car’s dashboard, this information is shown through graphics and pointers allowing the driver, at a quick glance, to interpret the information he needs .
This is the main objective of a visual management system: to provide as much information as possible without taking the focus off the main activity.
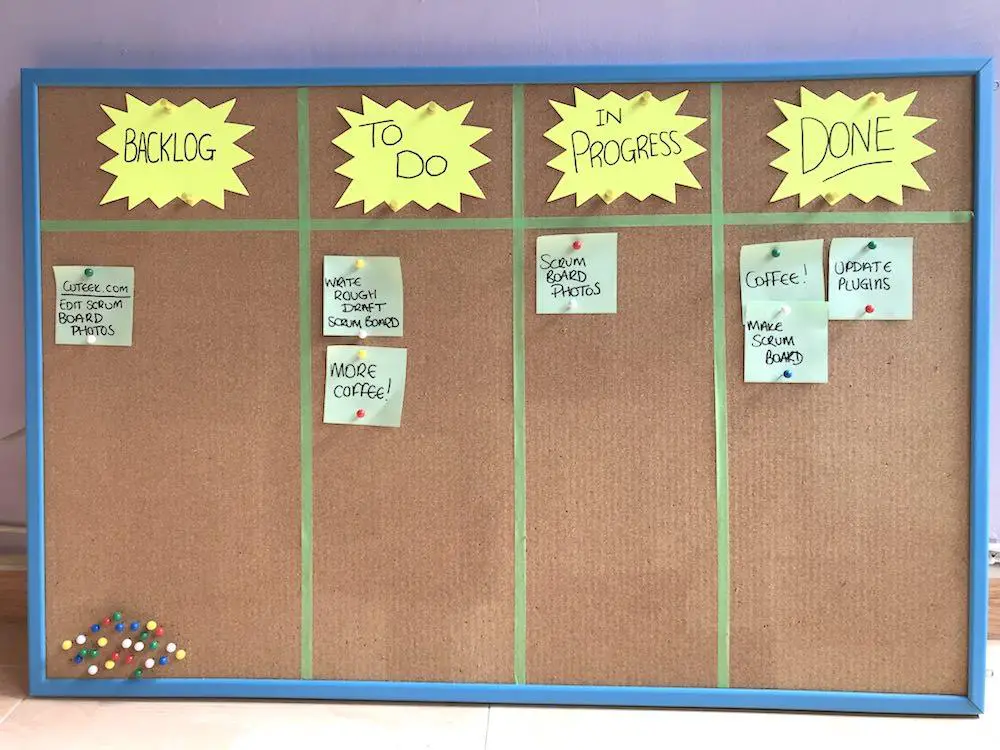
Source: cuteek.com
The resources used in a visual management system can range from bulletin boards to TV sets distributed by sectors and departments, connected to the IT system, showing in real time the evolution of the performance of the company’s activities.
The most important thing, before defining formats and features, is to determine what information should be displayed for the expected impact . Employees need to understand that they are responsible for performing the information they are tracking.
Read: 8 Types of visual aids to use in your marketing strategy
Practical examples
In order to implement visual management, managers should be know that the chosen form and resources are the ones that will best bring the expected results of engagement and performance, as the improvement of productivity in the company, for example. The more the visual information is related to the activities of those who have access to it, the greater should be the sense of responsibility in carrying out the tasks. Below we will present some practical visual management examples.
Activity Board
It has the function of an organizer . It informs the team about the activities that must be carried out and also manages the progress of the company’s projects. Each department has the flexibility to keep in the activity framework what is most relevant to achieving its own goals and which can facilitate communication between its members. It is also important that you have a way to present the results achieved. The Kanban with their picture cards, is a table of activities for example.
Read: How Workload Management Tools Can Help You Streamline Your Processes
Indicators Dashboard
It is a visual dashboard that gathers data from various metrics and indicators in the form of graphs and tables. It is an excellent monitoring system that shows a lot of related information simultaneously . With IT resources, dashboards are increasingly in use as they allow real-time visual management, which is essential for quick decision making.
Period Planning
Period planning is a tool that indicates what actions teams and the company need to take. It creates action plans and takes into account difficulties that may compromise the realization of each one of them . It also helps to verify who is responsible for each activity, the deadlines for execution, the result to be achieved and the necessary investment.
Goal Tracking
Shows what was planned and presents the results. This tool works by making a comparison between planned and actual for each action established to achieve the goals of short, medium and long term.
Behavior management
Visual management for employee’s behavior should be used more for awareness and education. It should not serve as an assessment. There is a maxim in feedback techniques that says that criticism is done individually and praise is done collectively. Behavior Management should be used for practical tips and attitudes aimed at positive attitudes . It also enables the construction of an organizational climate of commitment among employees and theirs towards the company’s objectives.
Read: Internet Monitoring Software Helps to Increase Employee Productivity
Safety at work
Employee safety is an increasingly constant concern in companies. Accidents at work, in addition to the risk to human beings, also represent costs. Visual management can act as prevention, promoting awareness among employees about behavior and the use of protective equipment in each sector of the company, aiming at safety at work.
Visual Management and Increased Productivity
To increase a company’s productivity, the first step is to measure the performance of activities and processes and compare what was planned with what is being carried out.
Performance will show the amount of items that a process can generate and rework and waste will show the consumption of company resources, for example. Once you have these measures, it is necessary to communicate to the team, with total transparency, your performance, because this will be the starting point for everyone to contribute with the necessary improvements.
Read: Top Chrome extensions to improve productivity
Visual Management can be this communication channel, informing results achieved and how the proposed improvements are contributing to the increase in the company’s productivity.
If you like the content, we would appreciate your support by buying us a coffee. Thank you so much for your visit and support.